
Pacific NorthWest LNG Project
From the Canadian Environmental Assessment Agency to Pacific NorthWest LNG re: follow-up to prior Information Requests
Document reference number: 86
Canadian Environmental Assessment Agency
PO Box 10114
701 West Georgia Street
Suite 410
Vancouver, British Columbia
V7Y 1C6
Agence canadienne d'évaluation environnementale
Boite postale 10114
701 rue Georgia ouest
Bureau 410
Vancouver (Colombie-Britannique)
V7Y 1C6
June 2, 2015
Mr. Michael Lambert
Head, Environmental and Regulatory Affairs
Pacific NorthWest LNG Ltd.
Oceanic Plaza, Suite 1900
1066 West Hastings Street
Vancouver BC V6E 3X1
Dear Mr. Lambert:
Thank you for your May 5 and May 10, 2015 responses to the Canadian Environmental Assessment Agency's (the Agency) February 23, 2015 letter (Information Request #3) requesting 3D modeling work to assess potential environmental effects of the Pacific NorthWest LNG Project (the Project) on Flora Bank and resulting effects on fish and fish habitat due to sediment transport and hydrodynamic changes.
The Agency appreciates Pacific NorthWest LNG Ltd.'s (PNW) determination to ensure a thorough and credible environmental assessment can be completed and we acknowledge the significant progress that has been made towards this end. I also note PNW's proposal, outlined in your May 27, 2015 e-mail messages, to conduct further modeling work aimed at:
- reducing uncertainty around potential effects of the Project on Flora Bank and resulting effects on fish and fish habitat; and
- evaluating and assessing, in collaboration with government and Tsimshian First Nations, the effects of the Project on Skeena River salmon populations.
As you know, the Agency has sought comments from federal experts from Fisheries and Oceans Canada and Natural Resources Canada on the 3D modeling results the PNW has provided. In assessing these results, the Agency also considered comments from the Lax Kw'alaams Band and Metlakatla First Nation.
Taking into account all of the comments received, the Agency is of the view that PNW has not yet provided all of the information identified in Information Request #3. In particular, the technical review provided by Natural Resources Canada and Fisheries and Oceans Canada indicates that their expert advice and direction to PNW in conducting its modeling work was not sufficiently taken into consideration, which has resulted in a lack of information. Expert federal departments have indicated that a more consistent application of the model instructions and a clearer articulation of underlying assumptions would provide greater certainty with respect to the modeling conclusions. You will find annexed the submissions of Natural Resources Canada (Annex I) and Fisheries and Oceans Canada (Annex II). In this context, the Agency continues to be of the opinion that the information provided is not adequate for the purpose of completing the environmental assessment and preparing the report with respect to the environmental assessment of the Project.
You have inquired as to whether the Agency is satisfied with PNW's responses to Information Request #2. In carefully reviewing those responses the Agency has determined that many of the information requirements have been sufficiently addressed and some information is no longer required due to the changes in design (i.e., dredging has been dramatically reduced). However, in addition to the deficiencies related to fish and fish habitat that there are the focus of the February 23, 2015 Information Request, three areas remain where PNW has not yet fully satisfied the previous information request, including effects:
- on current Aboriginal fisheries for traditional purposes;
- on marine mammals; and
- of dredged material disposal
The Agency would ask PNW to continue working to provide the outstanding information set out in Annex III in order to enable us to complete the environmental assessment and prepare the environmental assessment report. For greater clarity, I confirm that the Agency considers other aspects of Information Request #2 to have been satisfied for the purposes of completing the environmental assessment report.
Going forward, the Agency remains committed to working with you, federal department experts and Aboriginal groups to confirm the necessary work that would be undertaken collaboratively to support the completion of the environmental assessment process. The Agency will be contacting you to arrange meetings in Vancouver with senior federal officials to discuss these matters in further details with PNW's representatives. Regarding the modeling work, the Agency intends to set up a meeting with PNW and representatives from Fisheries and Oceans Canada and Natural Resources Canada to collectively clarify assumptions and data sources before PNW updates its modeling work.
Regarding the regulatory timeline, the Agency will operate in accordance with the requirements of subsection 27.(6) of CEAA 2012:
If, under subsection 23(2), the Agency requires the proponent of a designated project to collect information or undertake a study with respect to the designated project, the the period that is taken by the proponent, in the Agency's opinion, to comply with the requirements is no included in the calculation of the time limit within which the Minister's decisions must be made.
The federal timeline within which the Minister of Environment's decisions must be made is therefore paused as of June 2, 2015 and will resume once the Agency determines that the information provided satisfies the February 23, 2015 Information Request and the outstanding information from Information Request #2. In the meantime, we are committed to continue working with PNW to complete the environmental assessment within the legal timeframes and we remain available to review preliminary or draft information as it becomes available so it can be considered in a timely manner.
The Agency appreciates your continued collaboration on this important file and we look forward to working with you on these next steps. Please don't hesitate to contact me with any question or concerns.
Sincerely,
<signature removed>
Catherine Ponsford
Project Manager
Attachments:
Annex I - May 29, 2015 Comments from Natural Resources Canada
Annex II - May 29, 2015 Comments from Fisheries and Oceans Canada
Annex III - Outstanding Information from Information Request #2
c.c.:
Renny Talbot, Fisheries and Oceans Canada
Nick Russo, Environment Canada
Yota Hatziantonio, Health Canada
Jessican Coulson, Natural Resources Canada
Paula Doucette, Transport Canada
Janet Mercer, Parks Canada
Jack Smith, Prince Rupert Port Authority
Jim Delaney, Major Projects Management Office
Pacific NorthWest LNG Technical Working Group members
Annex I - May 29, 2015 Comments from Natural Resources Canada
Environmental Assessment Division
580 Booth Street
Ottawa, ON K1A OE4
May 29, 2015
CEAR Reference number: #80032
Catherine Ponsford
Project Manager
Canadian Environmental Assessment Agency, Pacific and Yukon Region
Re: Natural Resources Canada Technical Review: Pacific NorthWest LNG - Modeling of Potential Effects of Marine Structures on Site Hydrodynamics and Sedimentation
The attached submission represents NRCan's final technical review of the sediment transport aspects of the modeling completed for the Pacific Northwest (PNW) LNG Project, which assesses the potential effects of marine structures on hydrodynamics and sediment deposition on Flora Bank. NRCan is obligated under the Canadian Environmental Assessment Act 2012 (CEAA 2012) to provide specialist or expert information or knowledge to the Canadian Environmental Assessment Agency (Agency), who is the Responsible Authority for the designated project.
Background
On February 23, 2015, the Agency issued an Information Request (IR) to the Proponent to better understand the environmental effects that might be caused by the project pertaining to sediment transport and hydrodynamic changes, and associated effects to fish and fish habitat on Flora Bank. Following comments from parties, including from NRCan on February 26, March 3, March 6 and March 11, the Proponent finalized a Terms of Reference (ToR) on March 19 outlining the objectives of 3D modeling work that it would undertake to address the Agency's IR. Following comments from parties on the preliminary 3D modeling results for natural conditions and the preliminary 3D modeling results for post-construction conditions (April 8 and 21 respectively), the Proponent submitted its response to the IR on May 5. At that time, the Agency requested NRCan and Fisheries and Oceans Canada (DFO) expert review, to further assist in determining whether the project is likely to cause significant adverse environmental effects to fish and fish habitat at Flora Bank.
NRCan's Review
NRCan's response to the Agency's specific questions, and NRCan's substantive technical review of Appendix B, 3D Modeling of Potential Effects of Marine Structures on Site Hydrodynamics and Sedimentation (May 5, 2015), are attached to this letter. NRCan's review has identified deficiencies in how the modeling was undertaken, gaps in the results provided in Appendix B, and inconsistencies with its conclusions. We have identified and summarized key issues below.
Modeling Approach
The Delft3D modeling approach is, in our view, an appropriate method to assess the impacts of the proposed marine structures on Flora Bank, and the Proponent's May 5 report has meaningfully improved our understanding of the potential for changes from the previous 2D modeling study by including averaged effects of storm waves, predictions of sediment erosion and suspended sediment concentration, and long-term morphological changes. We acknowledge that the 3D modeling approach, undertaken at this time, has inherent limitations based on the availability of certain baseline information specific to Flora Bank - measured data for tidal currents, wave, suspended sediment concentration and sediment transport rates, which could be used to further calibrate and verify model predictions, are not available at this time.
Model inputs - wave, wind and current values / extreme storms
NRCan recommended (April 8 and 21) that the 3D model needs to be run with real (e.g. hourly) wind, wave, and river discharge data, which was in agreement with the ToR (item 2a p.7). NRCan identified that it is important to have estimates of the maximum waves, shear stress, suspended sediment concentration, and sediment transport flux over the duration of the selected case in order to assess their impact on benthic habitats. NRCan's view is-supported by other studies where spatially-variable time series wind data drive the wave model, and currents and sediment transport are modelled in hourly intervals to simulate erosion/deposition and bathymetric changes for several months and up to a year (Harris et al., 2008; Ulses et al., 2008; Xu et al., 2001).
However, the Proponent used a weekly case method, employing mean wind data and modeling currents and sediment transport for only 12.4 hours out of the duration of a week. The weekly case method does not simulate the full extent of the tidal and storm processes. Additionally, the Proponent used insufficient duration and time series of wind speed in the extreme storm scenarios. Detailed results from the extreme storm modeling were not provided.
The consequence of this method is, in NRCan's view, that the current model underestimates the maximum impact of major storm events on sediment transport. This would be true during both "natural conditions" and "marine infrastructure" conditions.
Without having simulated the full extent of the tidal and storm processes, the Proponent nonetheless concludes that potential changes of erosion and deposition caused by the marine structures are consistent in scale with the naturally occurring variations on Flora Bank. In NRCan's view, this conclusion is not supported by the current modeling approach. NRCan's advice remains that conclusions on the potential impacts of marine structures on Flora Bank need to be tested with results from model runs of the time series approach using hourly wind, wave and current data.
Model outputs
Based in part on NRCan's advice of March 6, the ToR required that both the baseline and the postconstruction modeling results include
- suspended sediment concentration and sediment transport rate and direction at different stages of tidal cycles, the Skeena River discharge cycle, and durations of selected storms, and
- net sediment transport flux and direction, and net erosion and deposition rates and distribution patterns (geomorphological changes) averaged over durations of selected modeling scenarios and over the duration of selected extreme storms.
The Proponent provided data for waves, currents, and total suspended sediment (TSS) concentration, to some degree. However, specific results were not presented to show:
- changes to sediment transport by the marine terminal structures;
- net sediment transport flux and direction over durations of selected modeling scenarios and how this will be impacted by the marine structures; and,
- long-term loss of sand or increase of sedimentation of fine silt on Flora Bank was not quantified.
Additionally, NRCan notes that the comparison presented by the Proponent for modelled TSS to measured TSS shows that the model under-estimates TSS. The maximum values and durations of TSS cannot be derived from the weekly case approach of the Proponent.
As a result, no specific information was presented to show changes to sediment transport by the marine terminal structures, and the long-term loss of sand or increase of sedimentation of fine silt on Flora Bank was not quantified.
In NRCan's view, the Proponent's conclusion that the effects of the marine structures on TSS concentrations were very slight is unsubstantiated; the available data from the Proponent suggests underestimation. This underestimation suggests further uncertainty on the net erosion and deposition on Flora Bank predicted by the model. Similarly, the Proponent's conclusion that there would not be long-term loss of sand or increased sedimentation of Flora Bank by fine silt materials is not supported with results from the model.
Conclusion
NRCan's review identified material deficiencies with the model's averaged inputs for wave, wind and current values, as well as the model's assumptions regarding wind speed and direction. NRCan also identified gaps in the model output with respect to total suspended sediments and sediment transport. DFO, in its review, identified similar issues, as well as concerns with the spatial representation of wind and waves driving the regional model, and that the model likely underestimates the effects of the large marine structures.
Taking into account all of the concerns identified in NRCan's and DFO's reviews, the two departments share in the conclusion that the Proponent has not adequately substantiated its conclusions, and the departments share the view that the potential magnitude and extent of physical changes to Flora Bank from the proposed marine structures are uncertain, and likely underestimated.
Should you have any questions regarding the contents of this letter, please contact myself or Jessica Coulson, Team Leader, at Jessica.coulson@nrcan.gc.ca.
<signature removed>
John Clarke
Director, Environmental Assessment Division
cc:
Alain Magnan, DFO
Linda Richardson, NRCan
Attachments:
- NRCan response to the Agency's Information Request Questions Dated May 5, 2015
- NRCan's Technical Review of Appendix B, 3D Modeling of Potential Effects of Marine Structures on Site Hydrodynamics and Sedimentation (May, 2015)
Attachment 1
Pacific Northwest LNG
NRCan Response to the Agency Information Request questions Dated May 5, 2015
Response to the Canadian Environmental Assessment Agency's Questions:
In the review of the Proponent's submission, federal departments were requested by the Agency to respond to three specific questions to assist in the analysis and determination of conclusions of potential environmental effects. As requested, below are Natural Resources Canada's responses to the Agency's three questions.
Question #1: Based on the new information presented in the document listed above regarding hydrodynamic and sediment deposition effects on Flora Bank, what is your advice to the Agency regarding the likelihood of significant adverse effects to fish and fish habitat?
NRCan's review identified material deficiencies with the model's averaged inputs for wave, wind and current values, as well as the model's assumptions regarding wind speed and direction. NRCan also identified gaps in the model output with respect to total suspended sediments and sediment transport. DFO, in its review, identified similar issues, as well as concerns with the spatial representation of wind and waves driving the regional model, and that the model likely underestimates the effects of the large marine structures.
Taking into account all of the concerns identified in NRCan's and DFO's reviews, the two departments share in the conclusion that the Proponent has not adequately substantiated its conclusions, and the departments share the view that the potential magnitude and extent of physical changes to Flora Bank from the proposed marine structures are uncertain, and likely underestimated.
Question #2: Are there any mitigation measures that you would suggest to avoid significant adverse environmental effects due to hydrodynamic changes and sediment deposition? If yes, please describe such measures and why they are important.
Mitigation measures related to engineering design of bridge structures, best management practices to be implemented during the construction, maintenance, operation and decommissioning of a project in a marine setting, or offsets related to potential impacts to fisheries are outside of NRCan's expertise.
Question #3: Would you suggest any follow-up program elements to verify predictions regarding the hydrodynamic and sediment effects of the marine terminal? If yes, please describe the follow-up program elements and how they would help to verify the accuracy of the assessment or the effectiveness of mitigation measures to avoid significant adverse environmental effects.
In light of NRCan's current views, with respect to the Proponent's response to the Agency's Information Request, we are challenged at this time, to conclusively respond to this question.
However, the Agency may want to refer to NRCan's February 26 submission, where we encouraged the Proponent to obtain field measurement data of waves, currents, and suspended sediment concentration (SCC) over Flora Bank so that these data can be used to calibrate or verify model predictions.
NRCan's Technical Review of Appendix a, 3D Modeling of Potential Effects of Marine Structures on Site Hvdrodvnamics and Sedimentation (May, 2015)
Documents reviewed: Appendix B, 3D Modelling of Potential Effects of Marine Structures on Site Hydrodynamics and Sedimentation
General Comments:
NRCan recognizes that the 3D modelling approach improved substantially upon the 2D modelling study by including averaged effects of storm waves, predictions of sediment erosion and suspended sediment concentration, and long-term morphological changes caused by the construction of the marine structures. However, the weekly case method taken by the proponent using mean wind data and modelling currents and sediment transport for only 12.4 hours out of the duration of a week did not fully simulate the real physical processes and the maximum magnitude of the tides and storms. This results in some uncertainty on the model results of seabed erosion/deposition and morphological changes on Flora Bank.
The report concludes that modelling results based on the weekly case approach indicate that changes of erosion and deposition caused by the marine structures are consistent in scale with the naturally occurring variations on Flora Bank. This conclusion would need to be tested with modelling results using time series of real wind and wave data. The statement that the modelling results do not suggest longterm loss of sand or increased sedimentation on Flora Bank was not substantiated.
The final report emphasizes the long-term morphological changes in the project area. However, results of maximum suspended sediment concentration, sediment transport rate and direction, and seabed erosion and deposition for the duration of the selected modelling cases are important in order to assess their environmental impact. These estimates were either not provided or cannot be derived due to the methodology taken by the proponent.
Several information types identified as deliverables in the ToR document for 3D modelling were not provided. These include:
- suspended sediment concentration and sediment transport rate and direction at different stages of tidal cycles, the Skeena River discharge cycle, and durations of selected storms, and
- net sediment transport flux and direction averaged over durations of selected modelling scenarios and over the duration of selected extreme storms.
Specific Comments:
Sediment concentration calibration, Page ii (from Executive Summary):
The report states that the model was calibrated using measured water level, current, wave, and sediment concentration data in the vicinity of the project. Calibration of sediment concentration prediction presented in Table 8-1 shows poor agreement between modelled and measured suspended sediment concentration. This may suggest limitations of the model in predicting suspended sediment concentration.
2.5.1 Long-Term Simulations Using Weekly Cases (p. 23):
The report states that in multi-year applications of the Delft3D modelling suite, it is standard practice that several years of bathymetric changes (morphology) are simulated by schematization of model inputs. By running the model using representative cases (that may represent a few days, weeks or a few months, rather than hours or minutes) in combination with the use of the morphological acceleration factor (MORFAC), long-term model applications and calibration become feasible and model runtime is reduced.
NRCan recognizes that the approach of using representative cases and morphological acceleration factors is commonly used for accelerated morphological change predictions. However, the weekly case approach using weekly mean wind and running the models for only 12.4 hours for each week has limitations to model the real tidal and storm processes and to capture the full extent of the maximum magnitude of wave height, currents, suspended sediment concentration, and sediment transport rate during storms.
NRCan would like to point out that in the sediment transport research community, the accepted standard is to use spatially variable time series (e.g. 3 hourly) wind data to drive the wave model and model currents and sediment transport in hourly intervals to simulate erosion/deposition and bathymetric changes for several months and up to a year (Harris et al., 2008; Ulses et al., 2008; Xu et al., 2001).NRCan emphasizes that the time series approach most accurately captures the natural current, wave, and sediment transport processes and hence produces lest biased long-term morphological changes. The use of MORFAC values in weekly case approach should only be considered for accelerated morphological predictions under constrained time situations and it should be understood that the use of any MORFAC values will produce biased morphological predictions. The proponent also stated this on p. 66: "Based upon the literature and experience, estimates of bathymetric change using weekly cases (MORFAC = 13.55) were not expected to exactly equal to those given generated time-series of hourly wind and wave records and the actual tides (MORFAC = 1.0). This has been acknowledged by Roelvink (2006)."
Sensitivity test for using MORFAC, p. 31:
To evaluate the effect of using the morphological acceleration factor with weekly cases versus running sequential hourly input time series, a four week comparison was performed using the local winds, waves, tides and Skeena River discharges between January 17 and February 14, 2015. The comparison (Fig. 4-4) indicates that the patterns of scour and deposition are similar and the magnitude of simulated change is greater for the weekly case results (details on this comparison are given in Section 4.1).
The comparison of predicted morphologic changes in Fig. 4-4 shows that the changes predicted using real time wind and waves are different from that using weekly case with a MORFAC value of 13.55. The report did not provide enough information that can be used to assess the possible bias of the weekly case approach in simulating the maximum effects of storms on currents, sediment transport, and seabed erosion and deposition.
Sensitivity Test Using 10 sigma layers, p. 93:
The statement at the bottom of p. 93 "This sensitivity test demonstrated that the changes in the vertical current profile are negligible using 10 sigma layers instead of five. Therefore the five sigma layers are proper to simulate velocity profiles over the project area and increasing the number of layers wouldn't represent better results" is not totally correct. Figures 4-26 and 4-29 do show that the modelled near-bed current using 10 sigma layers was smaller and the height was closer to the seabed, both of which would affect sediment transport calculations. The decision to eventually use the 5-sigma layers could be justified by considering the greater computation time and the limited differences in the predicted currents for the use of 10-sigma layers.
6.4 Long-Term Simulations With and Without Marine Structures, p. 146:
- Values in Table 6-2 are unclear. For H, the maximum difference is listed as 0.03 m yet the minimum difference is 0.10 m. If Minimum Difference means the maximum decrease in wave height, then values in the lower row should be negative. Recommend list maximum decrease and maximum increase for each location.
- The statement "changes in wave heights on the order of centimetres due to the marine structures are negligible" is debatable. The maximum Hs at T7 is 0.41 m (see Table 6-1). The maximum difference due to the marine structures is 0.1 m which is 25% of the maximum Hs under the baseline condition. This relative change is not negligible.
7.1.1 Measured vs. Modelled morphology, pp. 150-151:
Given that the bathymetric surveys conducted in 2012 and 2014 had an uncertainty of 0.25 m, the proponent put too much emphasis on the comparison between observed and modelled bathymetric changes between these two years. Bathymetric surveys largely show deposition up to 0.3 to 0.7 m on Agnew Bank while the modelling results show no changes. On the northern edge of Flora Bank just south of Porpoise Channel, bathymetric surveys again show largely depositions while the modelling results suggest alternating deposition and erosion. Given these discrepancies and the bathymetric survey accuracy of +/-0.25 m, the statement of "This comparison provides confidence that the model is capturing the same morphology trends, especially in the area of Flora Bank" by the proponent is not supported.
7.3 Long-Term Simulations With and Without Marine Structures, p. 163:
Eight points were selected along Flora Bank to demonstrate the morphological evolution during the 5-year simulations with and without the marine structures (Figures 7-15, 7-16, 7-17 and Table 7-1).
- The report states that the maximum deposition and erosion due to the marine structures did not always occur at the end of the long-term simulation, showing that the changes are dynamic and the trends can reverse along the years. For example, Table 7-1 indicates that 0.18 m deposition occurred at the end of the 5-year simulation at P2. However, the maximum deposition over the 5 years was 0.35 m. The report should have indicated that the maximum erosion and deposition values shown in Table 7-1 are based on model runs using weekly mean wind and wave input data. It can be expected that these maximum values will be much greater if much stronger time series wind and wave data were used in the model runs.
- The proponent concludes that the Delft3D model results indicate little change to the overall morphology patterns with the marine structures in place and that the site is dynamic and the terminal is not expected to cause change to the natural trends based on the modelled hydrodynamics and resulting morphology. NRCan would like to point out that while these statements may be correct for the weekly case approach based on weekly-mean wind and wave input, the validity of these conclusions remain to be tested by model results based on the time series approach using real hourly wind and wave data.
- The proponent also states that the modelling does not indicate a net change in erosion or deposition patterns, nor does the model predict a long-term loss of sand or increased sedimentation of fine silt materials of Flora Bank. The statement "the modelling does not indicate a net change in erosion or deposition patterns" is only partially correct. The comparison of erosion and deposition between the baseline and post-construction conditions in Fig. 7-9 shows that the construction of the marine structures will cause net localized erosion or deposition up to 0.2 m on the northern half of Flora Bank. The report did not provide information that can substantiate the statement that the modelling does not predict a long-term loss of sand or increased sedimentation of fine silt materials on Flora Bank. The long-term net loss or gain of sediment on Flora Bank can be quantified in two ways:
- The bathymetric change for all the points can be summed to calculate the sediment volume change for the baseline condition. This would establish if net erosion or deposition is occurring on the bank under the natural conditions. The same value can be calculated for the post-construction conditions. The difference between the two computed values would indicate whether the marine structures will cause long-term net loss or gain of sediment.
- Southwest to northeast transects can be drawn respectively along the northwest and southeast edges of Flora Bank. Total sediment transport from the 3D modelling results can be used to calculate the net flux across these transects to derive the net loss or gain of sediments on Flora Bank.
- The bathymetric change for all the points can be summed to calculate the sediment volume change for the baseline condition. This would establish if net erosion or deposition is occurring on the bank under the natural conditions. The same value can be calculated for the post-construction conditions. The difference between the two computed values would indicate whether the marine structures will cause long-term net loss or gain of sediment.
8.2 Long-Term Simulations of TSS with and Without Marine Structures, p. 167:
On p. 165, the report states that the threshold TSS limit for clear flow is a maximum increase of 25 mg/L from background levels for any short-term exposure (e.g. 24 hours period) and maximum average increase of 5 mg/L from background levels for longer term exposures (e.g. input lasting between 24 hours and 30 days). TSS should generally not increase by more than 10% above background levels when the background level is ≥ 250 mg/L.
Figs. 8-6 and 8-10 show that the TSS with marine structures at TSS3 site was ~100 mg/l higher than the background values of about 500 mg/l. This increase is more than 10% above background levels and thus exceeds the guideline criterion.
Table 8-2 indicates that at TSS3, the TSS values with marine structures were 5-25 mg/L higher than the background values for 3.3% of the time and the TSS was 25 mg/L above the background for 6.8% of the time. It would be important to show for the events when the TSS values with marine structures were 5-25 mg/L and more than 25 mg/L above the background values, what the average duration of these respective events are. However, the models were only run for 12.4 hours for each week in the weekly case approach and the present model results may not allow these statistics to be properly calculated.
9. Extreme Events, p. 182:
The base storm of 12/9/14 13:00-12/10/14 6:00 observed at PNW LNG Buoy with peak Hs of 1.48 m, Tp of 4.2 s, wave direction from 172 degrees was amplified to create extreme storms with 5, 20 and 50 year return periods. The wind data for the base storm were amplified to create wind data for the above extreme storms for the 12 hour period from 12/9 1900 to 12/10 0600 2014. The wind data for each storm were used to model waves, currents, transport and morphological changes for the baseline conditions and the post-construction conditions.
- Similar extreme storms with winds from the WNW should be modelled to assess the sheltering effects on Flora Bank.
- Storm duration and temporal variations of wind speed in the created extreme storms can be improved. As the peak Hs increases in stronger storms, the storm duration should be increased. The wind speed for each hour should be amplified by applying the ratio of the wind speed at the peak of the extreme storm versus that of the base storm.
- Information of maximum suspended sediment concentration, transport rate, net transport flux averaged over the storm duration for the baseline conditions, post-construction conditions, and the differences should be provided.
10.1 Assumptions, p. 203:
The report states "Schematization of model input into 260 weekly cases (52 weekly cases per year) simulates a wide range of combinations of wind, wave, tide and river discharge conditions and is representative of the natural variations that drive morphological changes." This statement is not totally correct. The use of weekly mean wind speed and constant direction and running the models only for 12.4 hours for each week will not capture the full effects of storms on suspended sediment concentration, sediment transport, and sediment deposition and erosion.
11. Conclusions (pp. 206 - 209):
At paragraph 1 p. 207: "Modelling of the baseline conditions over a five-year period indicated that the tidal currents are primarily responsible for driving the sediment transport and morphology within the project area, particularly on Flora Bank. Storm events characterized by high winds and breaking waves over Flora Bank also influence the morphology". This statement may imply that tidal currents play a more important role than waves for affecting sediment transport and morphology. No data and analysis were presented in the report to substantiate this implication. The weekly case approach using weekly RMS wind speed and running the models for only 12.4 hours will not adequately simulate the maximum waves during storms.
Paragraph 2 p. 207: On Flora Bank, Delft3D results indicate neither net erosion nor deposition for the baseline conditions. The report did not provide estimates of net sediment volume changes over Flora Bank by integrating erosion and deposition for all grid points over the bank.
Paragraph 6, p. 207: Numerous scenarios, both long-term and short-term, were simulated for the post-construction conditions to evaluate potential changes to waves, currents, sediment transport and morphology due to the presence of the marine terminal structures. No specific results were presented to show changes to sediment transport by the marine terminal structures.
Paragraph 3 p. 208: "The effects of the marine structures on TSS concentrations over the five-year simulation period were very slight, with very few increases in TSS due to marine structures greater than 5 mg/L. Marine structures did not cause TSS to significantly increase outside the natural range of variation". The comparisons between modelled and measured TSS in Table 8-1 suggest under-estimates of TSS by the model, which put into question the above statement. For the 5-year simulation with weekly case approach, the TSS values at TSS3 on Flora Bank with marine structures were 5-25 mg/L higher than the background values for 3.3% of the time and was 25 mg/L above the background for 6.8% of the time.
Paragraphs 4 and 5 p. 208, conclusions about morphological changes and net changes in erosion or deposition on Flora Bank: "The Delft3D model results indicate little change to the overall morphology patterns with the marine structures in place". "the terminal is not expected to result in changes to the natural conditions based on the modelled hydrodynamics and resulting morphology".
These statements were only true for the modelling results based on the weekly case approach. Should modeling efforts continue, they should be tested with results using real wind and wave data in a time series approach. The report states that modelling study does not indicate a net change in erosion or deposition patterns, nor does the model suggest long-term loss of sand or increased sedimentation of Flora Bank by fine silt materials. The report did not use the model results to quantify if long-term loss of sand or increase of sedimentation of fine silt occurs on Flora Bank. This conclusion appears not to be substantiated.
Appendix E Comments from the Government of Canada and Proponent Responses - from Appendix B:
28 Deliverable 1 NRCan:
While data of waves, currents, and suspended sediment concentration (to some degree) were presented in the final report, data on sediment transport (rate and direction) at different tidal stages, at different phases of the Skeena River seasonal cycle, and for durations of various storms were not included. Also results on net sediment transport flux and direction with implications for storms, seasonal, annual and longer period changes were not presented.
Publications cited:
Harris, C. K., C. R. Sherwood, R. P. Signell, A. J. Bever, and J. C. Warner (2008), Sediment dispersal in the northwestern Adriatic Sea, J. Geophys. Res., 113, C11S03, doi:10.1029/2006JC003868.
Ulses, c., Estournel, c., Durrieu de Madron, X., & Palanques, A. (2008). Suspended sediment transport in the Gulf of Lions (NW Mediterranean): Impact of extreme storms and floods. Continental Shelf Research 28: 2048-2070.
Xu, K., Harris, C.K., Hetland, R.D., Kaihatu, J.M., (2011). Dispersal of Mississippi and Atchafalaya sediment on the Texas-Louisiana shelf: Model estimates for the year 1993. Continental Shelf Research, 31, 1558-1575.
Annex 1: Additional NRCan Comments (e.g, clarification, editorial)
*NRCan's review also produced a number of recommendations that, if Appendix B is revised, the proponent can consider to improve or to augment the clarity of the report, as summarized below:
Clarification on Morphological Acceleration Factor (p. 30):
The report indicates that for each weekly case, the Tmodel period = 12.4 hours and the Tstudy period = 1 week or 168 hours, the MORFAC = Tstudy period / Tmodel period = 13.55. The MORFAC is achieved by multiplying the erosion and deposition fluxes from the bed to the flow and vice-versa by this scale factor for each computational time step.
More information and explanation could be added in this section, for example: What is the 'computational time step'? Is it each hour of the 12.4 hours of the model period? Assume the time step is each hour ofthe 12.4 hours ofthe model period, explain exactly how the morphological acceleration is achieved. For each hour, the model will compute the erosion and deposition fluxes. Is the computed erosion and deposition flux multiplied by the MORFAC 13.55 to achieve the morphological acceleration?
Sensitivity test for using MORFAC, p. 31:
NRCan suggests that the Proponent could provide the following additional data and graphs (as additions to Section 4.1) and evaluate these data to demonstrate the uncertainties ofthe weekly case approach in adequately modelling the maximum effects of storms:
- Comparison of maximum significant wave height H" peak wave period, near-bed current, shear stress, suspended sediment concentration, sediment transport rate and direction for both the weekly case approach and time series approach both spatially and at selected points on Flora Bank.
- Maximum erosion and deposition depth (derived from the hourly run data) for all points on Flora Bank from weekly case runs vs from each week of the time series runs
- Maps of maximum transport rate and direction for weekly case runs and for the strongest storm for each week from the time-series runs
- Maps of net sediment transport averaged over the 12.4 hours of the weekly case runs and over each week of the time series runs
Sediment Transport in Delft3D, p. 37:
It is not clear whether the equation at the bottom of p. 37 is used for the calculation of suspended load transport for both cohesive and non-cohesive sediments. This equation is too general to indicate how suspended load transport is obtained. Typically velocity and suspended sediment concentration profiles need to be computed and they are multiplied and integrated vertically to derive the suspended load transport.
It is not clear whether sediment concentration C is determined by the calculations of sediment erosion and deposition as described below.
Bottom shear stress T: The Proponent could have clarified how this is computed. Delft3D model can compute the combined wave-current shear stress when both processes are active. The Proponent could have explained how the shear stress due to the combined influence of waves and steady currents is calculated.
The Proponent could have provided a description of erosion and deposition of cohesive materials, references for the key cohesive sediment parameters (the critical shear stress for deposition, the critical shear stress for erosion, settling velocity, etc.).
It could be helpful if the Proponent defined the following: Bedload equation for non-cohesive sediments on p. 39: Uon.
Sediment Fractions (p. 40):
NRCan notes that for d>2 mm, the fraction should be Gravels. The grain sizes of coarse and very coarse sands are 0.5 - 2 mm.
- It could be helpful ifthe Proponent included grain size ranges for silts and clays.
- NRCan notes that sands (pg.41) - φ1A should be φ1B; and Clays - φ2A should be φ2B;
On p. 47:
NRCan notes that 'at Porpoise Channel' should be 'at the Prince Rupert Tide Gauge' .
Top of p. 57:
The report states "Holland Rock winds were selected and a 15% reduction of Holland Rock wind speeds was applied to calibrate the waves ... " An explanation could help the reader understand why the wind data at Holland Rock were selected for the use in this modelling study.
Fig. 3-14 and discussion on p. 61:
The Proponent should have noted that the wave model under estimated mean wave period for the duration December 25, 2013 - January 7, 2014 and an explanation should have been provided.
5.2 Freshet Period With and Without Marine Structures, p. 103:
- Since spatial patterns of tidal currents and current changes by marine structures were not presented in 5.4 Long-Term Simulations With and Without Marine Structures, the Proponent could have revised to provide better descriptions of impact of marine structures on currents and particularly quantitative values of current differences could have been included.
- In both paragraph 2 and paragraph 3, a statement could have been added to indicate that the current difference on Flora Bank due to marine structures was minimal.
- Paragraph 4, Current differences at low tide: The report could have indicated that depth-averaged currents were roughly decreased by 0.1 m/s on northern Flora Bank.
- Paragraph 5, Current differences at flood tide: The report could have stated that currents near SW anchor block and tower were decreased by 0.1-0.15 m/s, and that currents were increased by ~0.05 m/s north of these structures. No current changes were predicted for the remainder of Flora Bank.
5.3 Storm Conditions With and Without Marine Structures, p. 112:
- In comparison with the currents and current differences for the freshet conditions, Figures 5-11 to Figure 5-18 for the storm conditions demonstrate that storms altered the magnitude and direction of the currents from the non-storm conditions. The marine structures will also cause greater increase and decrease of currents (compare Figure 5-8 and Figure 5-16). Maximum changes of currents are up to 0.3 m/s. The Proponent could have included a paragraph to describe these differences.
- NRCan notes that Fig. 5-18 should be at flood tide (not at high water);
- This section could have included a paragraph that summarizes the magnitude and spatial distribution of current differences for storm conditions caused by the construction of the marine structures.
5.4 Long-Term Simulations With and Without Marine Structures (p. 121):
- for clarity, NRCan notes that the row titles of Table 5-2 should be "Maximum increase with MS" and "Maximum decrease with MS"
- Maximum increase and decrease and Histogram of the Difference in Currents for the Flora Bank location shown in Fig. 5-1 could be included.
6.2 Storm Conditions With and Without Marine Structures, p. 128:
- The report did not provide quantitative description of the effect on waves by the marine structures. The marine structures cause decrease of significant wave height Hs by up to 0.2 m around and downwind from the structures. A slight increase of 0.05 - 0.1 m over Flora Bank is predicted at low water and flood tide.
- Changes to waves by the marine structures under storm conditions were shown in Figures 6-2 to 6-9. Because of the use of weekly mean wind data, significant wave heights were < 0.5 m on Flora Bank even for this storm conditions. The Proponent illustrate here the Hs and changes to waves at early, peak, and waning stages of the storms used in the sensitivity test in Section 4.1 to better demonstrate the impact on waves by the marine structures.
6.3 Freshet Period With and Without Marine Structures, p. 137:
The report could have provided quantitative description of effects on the waves by the marine structures. Hs was decreased by 0.1- 0.2 m around the structures and in the lee of the structures.
7.2 Long-Term Morphology Results p. 151:
Figure 7-9 displays the differences of modelled bathymetry in 2017 with and without the marine structures. This figure shows that the construction of the marine structures will cause localized increases of erosion and deposition up to 0.2 m on the northern half of Flora Bank. The Proponent could have provided text on this page to include this interpretation.
8.1 Baseline Conditions for Total Suspended Solids (TSS), p. 165:
- The locations of model output of TSS were more than 1000 m apart from the locations of measured data. Could the model output be interpolated so that the modelled and measured TSS can be compared for the same positions?
- Comparison listed in Table 8-1: The Proponent could have clarified the meaning of the measured TSS values: are these averaged for the day indicated in the Table?
- The values in Table 8-1 suggest poor agreement between modelled and measured TSS, casting doubt on the performance of the model in predicting suspended sediment concentration.
8.2 Long-Term Simulations of TSS With and Without Marine Structures, p. 167:
- It is recommended the report could have indicated whether the TSS values presented in Fig. 8-3 are depth-averaged or at certain height above the bottom.
11. Conclusions (p. 206 - 209):
Paragraph 1 p. 208: Effects on currents It is recommended that this paragraph could have indicated that under storm conditions, the marine structures will cause greater increase and decrease of currents. Maximum changes of currents are up to 0.3 m/s.
Paragraph 2 p. 208: Effects on waves It is recommended that the paragraph could have stated that the marine structures would cause maximum decrease of significant wave heights by 0.2 m during storms.
Annex II - May 29, 2015 Comments from Fisheries and Oceans Canada
Fisheries and Oceans Canada
Pacific Region
200 – 401 Burrard Street
Vancouver, British Columbia
V6C 3S4
Pêches et Océans Canada
Région du Pacifique
Pièce 200 – 401 rue Burrard
Vancouver (C.-B.)
V6C 3S4
Your file
Votre référence
CEAA: 80032
Our file
Notre référence
13-HPAC-PA6-00004
May 29, 2015
Catherine Ponsford
Project Manager
Canadian Environmental Assessment Agency
Pacific and Yukon Regional Office
410-701 Georgia Street West
Vancouver, BC V7Y 1C6
Dear Ms. Ponsford:
Subject: Departmental Response to the Canadian Environmental Assessment Agency Information Request Questions Dated May 5, 2015 Regarding the Pacific Northwest LNG Project
Fisheries and Oceans Canada (DFO) has completed its review of the Pacific Northwest LNG response to the Canadian Environmental Assessment Agency's (the Agency) Information Request (IR) of February 23, 2015. The Department has considered the information provided by the proponent with respect to this IR as well as the previous information submitted. The Department has also reviewed the information in the reports referenced and used by the proponent to draw their conclusions.
The Department acknowledges that the proponent has provided important new information. The additional 3D modelling work is useful and an improvement over the 2D model. The assessment of Flora Bank also provides some new information. The Department acknowledges improvements in the re-design of the proposed project that occurred in October 2014 which included the removal of a 7,000,000 m3 dredge and breakwater, and the inclusion of a 2.7 km combined suspension bridge and pile supported trestle from Lelu Island to the terminal berth. Finally, the Department would like to acknowledge Pacific Northwest's continued effort to work with the Department to understand potential project related impacts on fish and fish habitat.
However, the Department's review of the proponent's submission has identified two primary areas of concern with respect to the information provided. The first lies in the area of modelling, while the second revolves around the proponent's treatment of the ecological value of Flora Bank. These concerns are summarized below and laid out in detail in the attached appendices 1 and 2.
Modelling
With respect to modelling, since December, DFO has participated in the modelling exercise and has provided recommendations to the proponent on the various modelling studies. In developing the Terms of Reference for the study, DFO met several times with the proponent, in addition to providing formal comments on March 3, March 6, and March 18, 2015. DFO also provided comments on the preliminary results for the 3D modelling work on April 8 and April 21, 2015. The Department recommended that the proponent develop a regional model driven by gridded wind and wave data obtained from atmospheric/wave models, forcing with hourly waves, wind and tide values from extended time series, the proper spin-up time of the model, and the use of storm values calculated from multiple data sources with storm propagation considered from multiple directions. This issue was raised on a number of occasions with the proponent but was ultimately not taken up. Furthermore, the proponent was advised to implement the Delft3D model in accordance with all instructions and procedures featured in the model design.
The Department has concluded that several information types identified as deliverables in the Terms of Reference document for the 3D modelling were not provided. These include: a) suspended sediment concentration and sediment transport rate and direction at different stages of tidal cycles, the Skeena River discharge cycle, and durations of selection storms; and, b) net sediment transport flux and direction averaged over durations of selected modelling scenarios and over the duration of selected extreme storms. Furthermore, the Department's review concludes that the modelling work has not been implemented fully in accordance with the instructions and procedures associated with the model itself.
The proponent submitted a model driven by uniform winds derived from data from one local buoy, incident wave forcing derived from a single buoy record, weekly averaging of wind and waves data, use of a ‘representative' tide value, insufficient spin-up times, and extreme storm conditions calculated from a single buoy with single orientation of storm propagation.
In addition to the above, the anchor block and tower are, by far, the largest of the marine structures the proponent proposes to install. Despite this, the grid resolution of the model is insufficient to explicitly represent these structures, and they are instead parameterized as porous plates. As a result, the model does not properly represent the acceleration of the flow that will occur on the sides of these blocks.
Aside from DFO's comments above, in its review, Natural Resources Canada (NRCan) identified material deficiencies with the model's averaged inputs for wave, wind and current values, as well as the model's assumptions regarding wind speed and direction. NRCan also identified gaps in the model output with respect to total suspended sediments and sediment transport.
Taking into account the concerns identified in NRCan's and DFO's reviews, the two departments are of the view that the proponent has not adequately substantiated its conclusions and therefore, the potential magnitude and extent of physical changes to Flora Bank from the proposed marine structures are uncertain and likely underestimated.
Flora Bank
Separate and apart from our concerns with respect to the modelling, DFO has identified important shortcomings in the proponent's assessment of the fish and fish habitat values of Flora Bank. The proponent has characterized fish habitat on and adjacent to Flora Bank (including Horsey and Agnew banks) as not as biologically important as previously thought. Based on a review of the information submitted, the Department is of the opinion that the proponent has not provided sufficient information to support their conclusions. There has been limited direct new information collected over a short period of time, and incorrect use of information drawn from referenced studies. Further, the proponent's conclusion that Flora Bank eelgrass does not provide any habitat for juvenile salmonids was based on limited biological information and supported by assumptions that natural conditions limits fish utilization.
There has been important work done in and around Flora bank and the surrounding areas on fish utilization, habitat and mapping, the importance of eelgrass, and identification of ecologically and biologically significant areas. The proponent's conclusion represents a significant variance from the current state of information about the fish habitat values in this area and further work would be required to support their conclusions.
Given the concerns of the two expert departments with respect to the modelling, and given the above noted concerns with respect to habitat and fisheries values on Flora Bank, without further information, substantial uncertainty remains and the Department therefore concludes that the project may have significant adverse impacts on fish and fish habitat.
Should you have any questions regarding the contents of this letter, please contact myself or Mr. Alain Magnan at alain.magnan@dfo-mpo.gc.ca.
Yours sincerely,
Bonnie Antcliffe
Regional Director
Ecosystem Management Branch, Pacific Region
Attachments:
- DFO Response to the Agency Information Request Questions dated May 5, 2015
- DFO Canadian Science Advisory Secretariat (CSAS) review of the proponent's 3D model report
Cc:
Alain (Al) Magnan, DFO
Jessica Coulson, NRCan
AM/cd
Attachment 1
Pacific Northwest LNG
DFO Response to the Agency Information Request Questions Dated May 5, 2015
On February 23, 2015, the Canadian Environmental Assessment Agency (the Agency) submitted an Information Request to Pacific Northwest LNG (the proponent) pertaining to the potential effects of the marine terminal infrastructure on sediment transport and hydrodynamic changes of Flora Bank. On May 5, 2015, the proponent provided a response to the Agency's Information Request.
Fisheries and Oceans Canada (DFO) has completed its review of the Pacific Northwest LNG response to the Canadian Environmental Assessment Agency's (the Agency) Information Request (IR) of February 23, 2015. The Department has considered the information provided by the proponent with respect to this IR as well as the previous information submitted. The Department has also reviewed the information in the reports referenced and used by the proponent to draw their conclusions.
The Department's review of the proponent's submission has identified two primary areas of concern with respect to the information provided. The first lies in the area of modelling, while the second revolves around the proponent's treatment of the ecological value of Flora Bank.
Comments on the 3D modelling:
DFO science undertook a Canadian Science Advisory Secretariat (CSAS) review of the proponent's 3D model report. A summary of these findings are provided below. The full technical review is presented in the DFO science CSAS report which is provided as an attachment to the accompanying cover letter.
DFO Science has previously conducted four reviews and provided feedback on draft analyses conducted by the proponent on the baseline hydrodynamic regime, and the potential changes that may occur as a result of the installation of marine structures near Flora Bank. Many of the shortcomings and problematic aspects of the analyses noted in these previous reviews remain unaddressed in the final model report. The CSAS review has identified shortcomings and errors in the modelling procedures, input data, and assumptions, as well as in the assessment of uncertainties of the final report.
Specifically, the Department recommended that the proponent develop a regional model driven by gridded wind and wave data obtained from atmospheric/wave models, forcing with hourly waves, wind and tide values from extended time series, the proper spin-up time of the model, and the use of storm values calculated from multiple data sources with storm propagation considered from multiple directions. This issue was raised on a number of occasions with the proponent but was ultimately not taken up. Furthermore, the proponent was advised to implement the Delft3D model in accordance with all instructions and procedures featured in the model design.
The proponent submitted a model driven by uniform winds derived from data from one local buoy, incident wave forcing derived from a single buoy record, weekly averaging of wind and waves data, use of a 'representative' tide value, insufficient spin-up times, and extreme storm conditions calculated from a single buoy with single orientation of storm propagation.
The Department offers the following specific observations and conclusions of this review:
In the 'long-term' simulations, the model is driven by a 'representative' tide, along with weekly-averaged winds, waves and a river discharge in which the annual cycle is compressed into a 26.9 day period. This modelling procedure is of doubtful validity, and at variance with instructions given in the manual for the model. In the case of the river discharge, it is demonstrably incorrect.
The weekly averaging of the winds and waves eliminates the peaks in these forcing fields associated with the passage of storms, while use of a representative tide eliminates the largest tidal currents associated with spring tides. As a result, the likelihood of exceeding the critical threshold for sediment suspension and transport is underestimated in the model. As well, elimination of neap tides reduces the likelihood of meeting the threshold for sediment deposition.
The volume of freshwater and amount of suspended sediment discharged from the Skeena River into the coastal ocean is severely underrepresented in the model. This will lead to an underestimation of the buoyancy-driven circulation, as well as of the total suspended solids (TSS) in the water column. This observation casts considerable doubt on the assessment made regarding the impact of changes in the distribution of total suspended solids and in water clarity.
The 'spin-up' time allowed for the circulation driven by waves, winds and (especially) the buoyancy forcing to become established is too short. As a result, these motions are likely underrepresented. Similarly, the spin-up time allowed for the wave-module in Delft3D, per se, is too short, and would likely result in wave simulation estimates that are biased low.
The anchor block and tower are, by far, the largest of the marine structures the proponent proposes to install. Despite their large size (44m by 45m in one case), the grid resolution of the model is insufficient to explicitly represent these structures, and they are instead parameterized as porous plates. As a result, the model does not properly represent the acceleration of the flow that will occur on the sides of these blocks. The resolution of the model is also insufficient to represent properly the downstream turbulent wake and separated flows on either side of the anchor blocks, and the vortices generated by these anchor blocks that will be shed downstream and interact with Flora Bank. There is potential for these energetic flows to scour the sides of Flora Bank, but it is not possible to assess the extent to which this will occur based on the reported simulations.
The analysis does not adequately consider an extreme storm for the 50-year return period, or an appropriate set of 50-year extreme storms, thereby underestimating the potential impact of the installation of marine structures on the surrounding environment. Although the proponent does estimate the 50-year and 100-year winds at the Holland Rock buoy, based on 20 years of observed data, and application of standard extremal analysis, applying the well-known Gumbel distribution relation for the wind data, several of the other conditions needed to estimate extreme 50-year extreme storm impacts are scaled back or not explored. In particular, the analysis only considers a storm propagation direction that orients the marine structures downstream from Flora Bank, thus making it essentially impossible for the marine structures to impact Flora Bank. In addition, to fully explore the maximum severity of possible 50-year extreme storms, the duration of the maximum storm-generated winds should be modelled for multiple hours not one hour, for example half a day, and the winds considered at the known maxima, not scaled back by 15%, as in the current analysis.
Therefore, the results and conclusions presented in the proponent's analysis are not substantiated. Given the nature of these shortcomings, it is likely that the magnitude and extent of the impact of the marine structures is underestimated. Should the proponent continue the modelling efforts, DFO recommends that the full model be run with appropriate forcing, grid resolution, representation of marine structures, and over a duration that is appropriate for time scales of all the relevant physical processes.
Comments on the ecological value of Flora Bank:
With respect to the ecological value of Flora Bank, the proponent has characterized fish habitat on and adjacent to Flora Bank (including Horsey and Agnew banks) as not as biologically important as previously thought. Based on a review of the information submitted, the proponent has provided some new information that adds to the knowledge about these areas and the Skeena estuary in particular. There is not enough data or supporting information, however, to determine conclusively that Flora, Horsey and Agnew banks represent low value fish habitat. This is because of the limited sampling, the reliance on modelling, and the lack of new substantive biological information. In addition, the Department also notes that previous studies on fish and fish habitat (including eelgrass) have been undertaken, and reports produced, in relation to the Skeena River Estuary, including on and around Flora Bank. The proponent's characterization of the ecological value of Flora Bank is at significant variance from the current body of knowledge about fish habitat values in this area.
The value of eelgrass to commercial, recreational and Aboriginal fisheries cannot be overstated. Eelgrass is widely recognized as important near shore habitat for juvenile (and adult) invertebrates and fish. Eelgrass beds provide cover from predation, reduce local current regimes (allowing for settlement of organisms) and increase secondary productivity by adding to local habitat complexity and surface area.
The proponent's report implies that Flora Bank has the lowest eelgrass flora and fauna species richness of the all the eelgrass beds in Chatham Sound. In reviewing the reference where this information was taken the author identifies limitations in the data collected. For example, they state that general observations on benthic flora, fauna and substrate were made for each eelgrass site and that very small species (e.g. barnacles, small tube worms, small algal species), infauna (clams), cryptic fauna (flatfish, decorator crabs), or hidden fauna (e.g. under kelp fronds) were often not identified in the video footage).
Similarly, the proponent's report implies that Flora Bank benthic invertebrates are of low value. In the reference from which the proponent extracted this information, the author states that the information is based on a small number of samples and only affords a coarse assessment of the benthic invertebrate community structure of the estuarine benthos. Therefore, this should be considered an insufficient reference to reach a conclusion on benthic invertebrate density or diversity in or near Flora Bank.
The proponent concluded that the only CRA species utilizing Flora Bank eelgrass habitat is Dungeness crab. The proponent's conclusion that Flora Bank eelgrass does not provide any habitat for juvenile salmonids was based on limited biological information. This conclusion was supported by the assumption that tidal currents and natural turbidity on Flora Bank limits its use as foraging and nursery habitats for juvenile salmon and other fish and marine invertebrate species.
The proponent's findings are that there are "no life process dependent habitats" within Flora Bank. This conclusion seems to be reached by the fact that no moulting crabs were found during a sampling period (unpublished data). The area around Flora Bank supports some of the most productive crab fishing in the north coast area. Based on the number of crabs found in this area, the proponent has not provided sufficient supporting information to conclude that life dependent habitats do not exist within the Project area. The proponent's assessment of life dependent habitats failed to take into consideration the other CRA fish which have been captured or are known to occur in this area (e.g., halibut, flounder, English sole and big skate).
The proponent's assessment of the value of the Flora Bank eelgrass is not consistent with other similar studies, or previous studies undertaken by the proponent. For example, one of the conclusions reached in a report referenced by the proponent was that Flora Bank had the highest percent cover of any of the eelgrass beds in Chatham Sound and that the eelgrass was medium to tall in length (proponent described the Flora Bank eelgrass as having short leaf and shoots). The proponent's own consultant described the Flora Bank eelgrass beds in the 2014 Environmental Assessment submission as "eelgrass on Flora Bank grows extensive thick rhizomes with shoots and leaves greater than 0.5 m".
Other studies suggest that there are additional CRA species in the area (halibut is fished recreationally, for example) that have not been recognized by the proponent. The conclusion that the only CRA fish found on Flora Bank are crab is contradictory to the proponent's own fyke net sampling results (unpublished) which captured flounder during a single sampling period in March 2015. Another unpublished report by the proponent identified English sole and big skate (both CRA species) caught on the northwest edge of Flora/Agnew banks. Other species of forage fish were also captured on Flora Bank during the fyke net survey which speaks to the importance of this habitat to both CRA fish and fish that support a CRA fishery.
The Skeena River estuary is a highly productive area and previous studies point to the importance of the area in and around Flora Bank. The estuary is home to many marine mammals and supports numerous commercial, recreational and Aboriginal fisheries species. The frequency and abundance of juvenile salmon, herring, foraging fish, invertebrates and marine mammals found around Flora Bank indicate that the area in general is of importance to the fish stocks and the Skeena River estuarine ecosystem as whole. The proponent has provided additional information, but DFO is of the view that there is not enough data or supporting information to conclusively demonstrate that this current understanding of Flora Bank is incorrect.
Impacts to Flora Bank:
Based on DFO's review of the 3D model it is difficult to support the proponent's conclusion that the condition of habitat will not significantly change as a result of the marine infrastructure, and that any sediment transport, deposition and erosion changes to Flora Bank or adjacent area will be within natural variability.
While the proponent has indicated that after 5 years, approximately 2.0 ha (4.3%) of eelgrass habitat on Flora Bank will be impacted (greater than 5 cm of erosion or deposition), uncertainties associated with the model results, as well as the size and location of the Flora Bank eelgrass beds, brings into question the accuracy of this conclusion. The survey methods used to measure the size and distribution of the eelgrass beds on Flora Bank show a wide range of inconsistent measurements. For example, the proponent has previously provided estimates ranging from 0.33 km2 to 2.0 km2, with the most recent estimated size of the eelgrass beds on Flora Bank being approximately 0.46 km2 in total area. This most recent measurement is based on calculations using aerial photographs. Previous studies have shown that identifying eelgrass beds through aerial photography results in inconsistent measurements. For example, due to the high turbidity environment, any eelgrass that is not exposed during the taking of the photographs would not be captured in this assessment.
The model results indicate that the total area of intertidal habitat on Flora Bank potentially impacted (e.g. areas greater than 5 cm of erosion or deposition) by the marine structures is not consistent on a yearly basis. Taking into account both eelgrass habitat and non-eelgrass habitat on Flora Bank, potential marine structure related impacts were predicted by the proponent as follows: 0.2 ha (year 1), 1.19 ha (year 2), 1.98 ha (year 3), 5.63 ha (year 4) and 6.48 (year 5). These calculations would appear to indicate that the potential impacts to Flora Bank will continue to increase for the life of the project.
The proponent's 3D model predicted that there would be small increases in erosion and deposition on Flora Bank, which were considered consistent with naturally occurring variations. There was no predicted net change in erosion or deposition patterns on Flora Bank. DFO's review of the 3D model results indicated that the extent of the impacts of the marine structures was likely underestimated. This could potentially result in project related impacts to the Flora Bank eelgrass beds as any shift or change in the natural patterns of erosion and sedimentation could potentially impact some of this valuable habitat.
Response to the Canadian Environmental Assessment Agency's Questions:
In the review of the proponent's submission, federal departments were requested by the Agency to respond to three specific questions to assist in the analysis and determination of conclusions of potential environmental effects. As requested, below are Fisheries and Oceans Canada's (DFO) response to the Agency's three questions.
Question #1: Based on the new information presented in the document listed above regarding hydrodynamic and sediment deposition effects on Flora Bank, what is your advice to the Agency regarding the likelihood of significant adverse effects to fish and fish habitat?
As noted above and outlined in the accompanying cover letter and appended materials, DFO has concluded that the modelling work undertaken by the proponent contains important shortcomings and gaps. Given the nature of these deficiencies, the modelling work has likely underestimated the potential impact of the marine structures on Flora Bank and surrounding areas.
Aside from DFO's comments above, in its review, Natural Resources Canada (NRCan) identified material deficiencies with the model's averaged inputs for wave, wind and current values, as well as the model's assumptions regarding wind speed and direction. NRCan also identified gaps in the model output with respect to total suspended sediments and sediment transport.
Taking into account the concerns identified in NRCan's and DFO's reviews, the two departments are of the view that the proponent has not adequately substantiated its conclusions and therefore, the potential magnitude and extent of physical changes to Flora Bank from the proposed marine structures are uncertain and likely underestimated.
Separate and apart from our concerns with respect to modelling, DFO has identified important shortcomings in the proponent's assessment of the fish and fish habitat values of Flora Bank and the Department does not share the proponent's conclusion that Flora Bank is of low fish and fish habitat value.
Given the concerns of the two expert departments with respect to the modelling, and given the above noted concerns with respect to habitat and fisheries values on Flora Bank, without further information, substantial uncertainty remains and the Department therefore concludes that the project may have significant adverse impacts on fish and fish habitat.
Question #2: Are there any mitigation measures that you would suggest to avoid significant adverse environmental effects due to hydrodynamic changes and sediment deposition? If yes, please describe such measures and why they are important.
In light of our comments with respect to the proponent's submission, we are not in a position to provide a concluding response to these questions. We would however make some interim comments in the following areas:
- Engineering design of bridge structure or footings: Based on the review of the 3D model results, the primary factors affecting sedimentation on Flora Bank appear to consist of the bridge footings and bridge anchor points. Determining if there are appropriate engineering methods or design alternatives that can minimize the impacts of these structures (e.g., change in shape, configuration, alignment, relocation of footings, etc.) falls beyond the Department's expertise.
- Mitigation measures: Mitigation measures typically consist of best management practices implemented during the construction, maintenance, operation and decommissioning of a project. As potential sediment related impacts would occur following construction, mitigation measures would have to be applied to the operation phase of the project. The ability to mitigate sediment related impacts (e.g. sediment deposits and erosion) after the fact on the Flora Bank eelgrass would be difficult to implement, and could result in unexpected impacts to fish habitat. Any potential mitigation measures which would require engineering input is outside of the Department's expertise.
- Offsetting: The third mitigation option would be to offset potential impacts from the project that would cause Serious Harm to fish and fish habitat. The goal of offsetting measures is to maintain or improve the productivity of commercial, recreational, or Aboriginal fisheries. In addition, offset measures should support fisheries management objectives and local restoration priorities. Should the project result in impacts to Flora Bank eelgrass, this impact would need to be offset.
The size, location, density and value of the eelgrass beds on Flora Bank would need to be better understood to determine if this type of habitat could be offset at another location within Chatham Sound. Further studies might also help determine whether DFO's objective of providing for the sustainability and ongoing productivity of commercial, recreational and Aboriginal fisheries could be achieved by offsetting this valuable habitat at another site.
The offsetting of Flora Bank eelgrass would pose a challenge due to its specific location and fish habitat values. Flora Bank is located at the mouth of Inverness Passage. Previous studies have suggested that a large percentage of juvenile salmonids migrate through Inverness Passage channel as they begin their ocean migrations. The Flora Bank eelgrass beds are ideally situated at the mouth of Inverness Passage to provide juvenile fish a staging area for osmoregulation, resting and feeding prior to continuing on with their migration. Consequently, offsetting this important habitat elsewhere within the Skeena estuary may not provide similar fish habitat qualities as it presently provides on Flora Bank. Based on these issues, methods to avoid or mitigate impacts should be explored prior to looking at options to offset Flora Bank eelgrass.
Question #3: Would you suggest any follow-up program elements to verify predictions regarding the hydrodynamic and sediment effects of the marine terminal? If yes, please describe the follow-up program elements and how they would help to verify the accuracy of the assessment or the effectiveness of mitigation measures to avoid significant adverse environmental effects.
In light of our comments with respect to the proponent's submission, we are not in a position to provide a concluding response to these questions. We would however make some interim comments in the following areas:
- A follow-up monitoring program should consist of a study to quantify and qualify impacts on the Skeena River estuary in and adjacent to Flora Bank. In general, a follow-up monitoring program should include the following aspects:
- Eelgrass monitoring program: Distribution, density, physical structure (blade length etc.), and species.
- Substrate composition: Grain size, characterization of deposition layers.
- Flora Bank structure: Erosion and deposition areas and overall size and location.
- Water quality: TSS, Turbidity.
- Productivity: Abundance, utilization, distribution and composition of invertebrates, plankton, fish and marine mammals.
- Fisheries: Changes in commercial, recreational, and Aboriginal Catch Per Unit Effort.
- The follow-up monitoring program needs to be referenced against baseline conditions that have been collected in a frequency that can determine biological trends. Baseline and follow-up monitoring methodologies should be reviewed by an independent third party. The review should ensure that the methodologies proposed are in-line with DFO Science development project monitoring protocols that are being developed and will likely be published in 2015.
To determine the feasibility of eelgrass offsetting further work could be done to identify potential eelgrass offsetting measures in Chatham Sound. Once identified, the sites would be categorized and provided a prioritized rating for consideration as possible offsetting for any habitat impacts resulting from the project.
TECHNICAL REVIEW OF 3D MODELLING OF POTENTIAL EFFECTS OF MARINE STRUCTURES ON SITE HYDRODYNAMICS AND SEDIMENTATION FROM THE CONSTRUCTION OF THE PACIFIC NORTHWEST LIQUEFIED NATURAL GAS TERMINAL
Context
Pacific NorthWest Liquid Natural Gas (PNW LNG) is proposing to construct a large scale liquefied natural gas (LNG) export terminal within the Skeena River estuary (Figure 1) (hereafter referred to as the 'Project'). The Project will require dredging, blasting and pile driving to construct a suspended trestle and terminal berths.
On April 8, 2013 the Canadian Environmental Assessment Agency (the Agency) issued a Notice of Commencement that they had commenced an environmental assessment pursuant to the Canadian Environmental Assessment Act (CEAA 2012) for the PNW LNG project located on Lelu Island, BC.
The Environmental Impact Statement (EIS) and Addendum submitted by PNW LNG to the Canadian Environmental Assessment Agency (CEAA) on 28 Feb 2014 and 12 Dec 2014, respectively, provided information with regard to potential effects of marine operations and marine structures upon the sea bed and habitat at Agnew and Flora Banks (Figure 2). The Addendum also provided detailed responses to Information Requests posed by the Government of Canada in regard to sediment deposition; including a report that provides a sediment transport and deposition analysis that utilized 2D models (e.g., USCGA CMS and PTM ) conducted by PNW LNG's marine engineering consultant, Hatch.
On Feb 23 2015, PNW LNG received a new Information Request from CEAA, requesting additional 3D hydrodynamic and sedimentation modelling. A Terms of Reference was developed to guide the additional assessment (Hatch, 2015 – Appendix A).
DFO Science Branch provided informal advice to DFO Fisheries Protection Program on draft pre-construction and post construction modelling undertaken by the proponent to assess the potential effects of marine operations and marine structures upon the sea bed and habitat at Agnew and Flora Banks. On May 5, 2015, the Fisheries Protection Program requested that DFO Science review the final results from the above mentioned modelling exercise to support the development of DFO's response to CEAA.
The objective of this Science Response is to review information provided with respect to the above mentioned modelling in the Proponent's May 5, 2015 submission "Pacific Northwest LNG - 3D Modelling of Potential Effects of Marine Structures on Site Hydrodynamics and Sedimentation" (Hatch, 2015), and to answer the following questions by May 19, 2015:
- Can DFO Science comment on the level of uncertainty in the 3D model and implications for model accuracy?
- What is DFO Science's view of the model results?
This Science Response Report results from the Science Response Process of May 19, 2015 on the Technical review of 3D modelling of potential effects of marine structures on site hydrodynamics and sedimentation from the construction of the Pacific Northwest liquefied natural gas terminal.
Background
The Proponent describes the marine environment in the region of the Project, as noted in the following excerpt of their Technical Data Report – Marine (Stantec, 2013):
- The marine environments within the region of the Project are typical of BC's North Coast, while also falling within the indelible influence of the Skeena River. While the seafloor topography and substrata are typical of the fjordic North Coast, the Skeena River estuary affects the currents, salinity, and turbidity around the Project. In turn, this influence is reflected by some of the species and habitats seen around the local assessment area (LAA).
- Many different marine habitats are found around the site of the proposed Project, most of which are common throughout the North Coast region. Rocky foreshores dominate the intertidal areas. These feature a diverse assemblage of algae and invertebrates. Soft sediments accumulate in sheltered pockets along the coast and support a community of invertebrates that live within the substrate (such as polychaetes, clams and shrimp) and eelgrass. Subtidal habitats in the area are also typical of the region. Offshore areas constitute a mix of mud, sand, and gravel, rocky outcrops, and boulders; shallower substrata, and those within channels feature are more diverse, including extensive areas of hard bottom. A particularly notable ecological feature of the region is the extensive eelgrass bed on Flora Bank and the soft-sediment areas on the adjacent Agnew Banks. The importance of this area has long been recognized. This area plays an important rearing role for ocean-bound juvenile salmon and crustaceans such as Dungeness crab and Pandalus shrimp. Flora Bank eelgrass is largely restricted to the intertidal areas owing to thick suspended sediments that limit subtidal growth. This observation was supported by field studies and remote-sensing-based mapping. The diversity of marine habitats is echoed in the species that inhabit them. Rocky areas support diverse seaweeds communities, including kelps, which contribute food and shelter to invertebrates and fish. Though largely devoid of seaweeds, soft sediments provide suitable substrate for burrowing invertebrates, crabs, shrimp and flatfish.
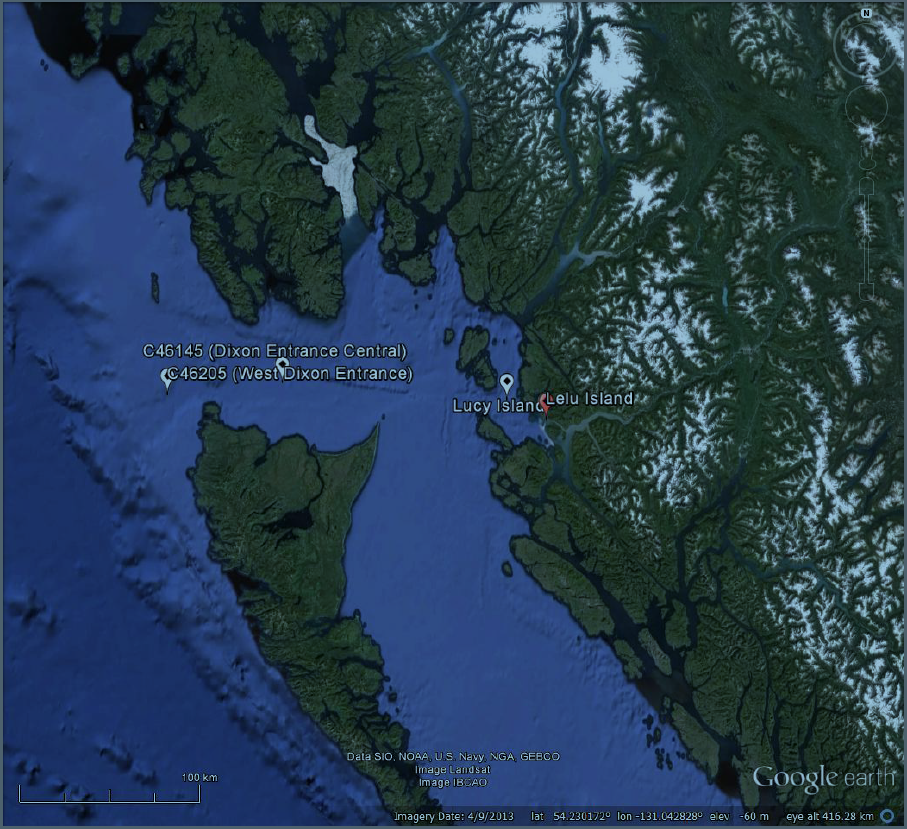
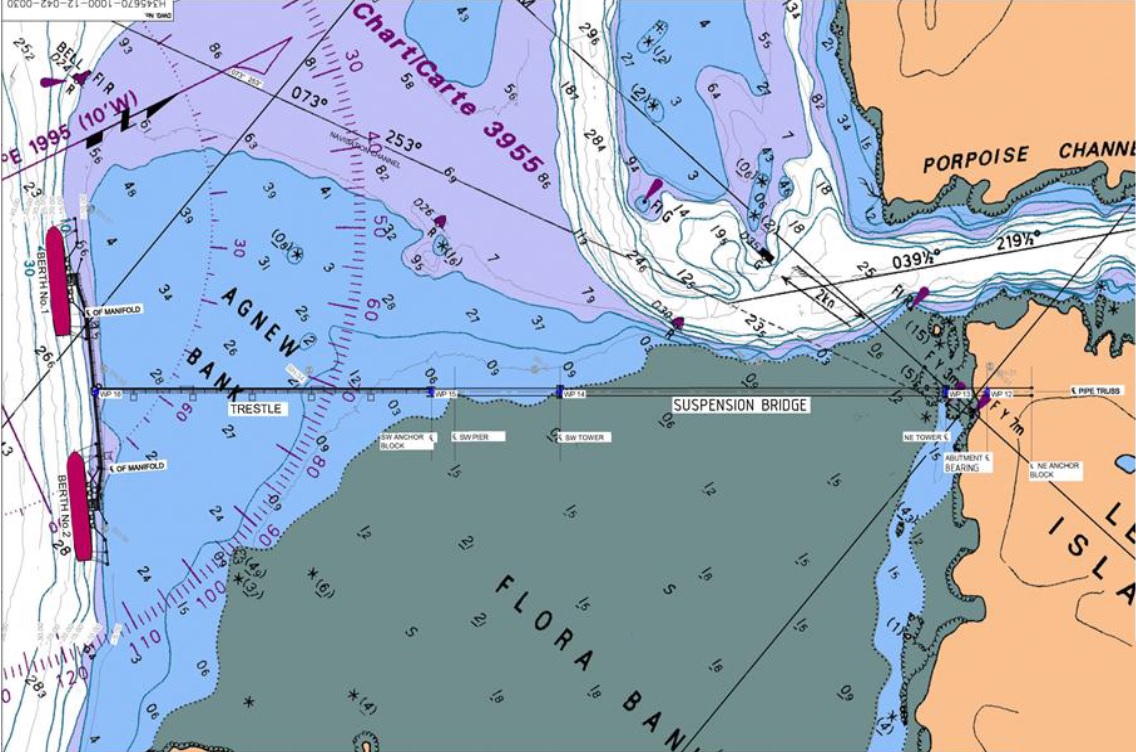
Predicting the changes to the currents and resulting sedimentation patterns, which may result from the construction and installation of the terminal facility, in these diverse and complex habitats, is necessary to assess the potential effects on the fish that inhabit the area (Figures 1 and 2). Conducting hydrodynamic modelling for the area potentially impacted, in both the pre-construction and post-construction state is necessary to understand the potential changes. Recognizing this deficiency in the draft Project EIS, CEAA requested additional analysis to be undertaken, as outlined in the Terms of Reference for 3D Modelling agreed to by CEAA and the proponent (see excerpt below).
The objective of the PNW LNG Delft3D modeling exercise is to respond to the CEAA Information request of Feb. 23, 2015 and to confirm and refine PNW LNG's determination of the Environmental Impact Statement and Addendum as to whether the proposed PNW LNG marine terminal infra-structure on Agnew Bank is likely to have significant adverse effects on fish and fish habitat by:
- Using the Delft3D model to characterize the baseline natural hydrodynamic and sediment transport regime using the inputs and model verification runs described below;
- Predicting the effects of PNW LNG's proposed marine terminal infrastructure on the hydrodynamic and sediment transport regime and long-term implications for morphology of Agnew and Flora Banks;
- Assessing the potential for adverse effects on fish and fish habitat due to any changes to the hydrodynamic regime or sedimentation processes; and
- Applying and incorporating the model results to answer questions and address concerns expressed by the Government of Canada regarding the 2D model work completed in 2014, specifically those of Natural Resources Canada (NRCan) dated January 9, 2015 (Appendix 1) and February 26, 2015 (Appendix 2), and the Department of Fisheries and Oceans (DFO) dated February 27, 2015 (Appendix 3).
To prepare this response, the following document from the Proponent was reviewed:
Hatch, 2015. Pacific Northwest LNG - 3D Modelling of Potential Effects of Marine Structures on Site Hydrodynamics and Sedimentation. 214 p. + Appendices A – D (35 p).
This CSAS Science Response reviews the modelling conducted by the Proponent to address the above items 1, 2, and 4 as presented in "Pacific Northwest LNG - 3D Modelling of Potential Effects of Marine Structures on Site Hydrodynamics and Sedimentation" (Hatch , 2015), hereafter called the "Report". Assessing the potential for adverse effects on fish and fish habitat due to any changes to the hydrodynamic regime or sedimentation process is not within the scope of this review.
Analysis and Response
Predicting the currents, and resulting sedimentation patterns, in diverse and complex habitats is done by conducting hydrodynamic modelling. Further, to understand the potential changes in the hydrodynamic regime, additional modelling must be done for the pre and post construction stages, taking into account the changes in flow resulting from installation of the marine structures. The following are the key components that such a modelling exercise would entail for the area of interest (Agnew and Flora Banks, Figure 2):
- Model Selection: A model, subject to forcing from tides, remotely and locally generated waves, wind-driven and buoyancy-driven currents, and allowing for sediment transport is required. The Delft3D model is a reliable model that has modern model components for these processes, aptly coupled together, and that allows for the representation of marine structures.
- Model Set-up Calibration and Validation: Delft3D should be implemented, with spatially fine-resolution integration grids, in the vertical and horizontal directions, and driven by appropriate boundary forcings. Models have parameters, like bottom roughness coefficients, that are selected for a wide range of conditions; for example, studies of marine storms and their impacts on the ocean from a number of other locations, such as the Gulf of St. Lawrence, the Gulf of Maine, the North Sea, etc. for optimal simulations. These parameters need to be tuned, or calibrated, for a selected set of severe storms, whereby model outputs of critical variables like wave heights would be compared to measured observations from buoys. Evaluation of the model can then involve a second independent set of severe storms, comparing model estimates with observations from buoys. This should include the following:
Outer boundary conditions: These refer to the driving fields for the outer boundary grid-points, including wave data for the wave model, SWAN, which is the wave model within Delft3D; temperature, salinity and currents data for the ocean model component of Delft3D; and atmospheric fields, in the case where a mesoscale atmospheric model is implemented to specify the atmospheric driving fields within the area of interest.
Waves: Waves generally need to have a large domain grid, because often swell waves propagate from large ocean basin-scale distances, sometimes even crossing the Pacific, to impact coastal ocean areas. Alternately, if the wave model is implemented on a small domain grid, then reliable wave data (e.g. from NOAA's global wave model simulations) can be used to specify wave conditions at all the boundary grid points of the integration domain.
Tides: Tides over the region can be characterized as mixed and dominantly semi-diurnal. Tidal heights and currents typically show a pronounced fortnightly modulation, with the tidal range varying between seven meters during spring tides, to about four meters during neaps. Since the modelled region is relatively small, tidal forcing is included as a forcing at the boundaries, and the astronomical forcing is neglected.
River discharge: Flora and Agnew Banks are located within the immediate proximity of the Skeena River, which drains a large watershed with an areal extent of 56,000 square kilometers. The rate of freshwater discharge from the Skeena typically varies from a minimum of about 410 cubic meters per second in March, to over 4300 cubic meters per second in June, during the spring freshet (Morrison et al.,, 2012). Inclusion of the Skeena River discharge in the model is important for establishing the cross-shore density stratification and the buoyancy-driven circulation. In addition to being the dominant source of fresh water, the Skeena River also is a major source of suspended solids for the region. Sediment concentrations in Skeena River water have a marked seasonal variation, peaking during the spring freshet (e.g., Figure 2.6 of the report).
Density stratification: Vertical and lateral gradients in seawater density over the region are due mainly to variations in salinity arising from coastal freshwater runoff. The model could be initialized with a climatological salinity field, or the variations in salinity may be allowed to develop in response to freshwater runoff at the coast. - Model Application - Present Climate storm conditions: Simulations using present climate conditions (i.e. historical data from past 20+ years) should be done with the composite Delft3D model system. This should involve a representative sample of present severe storms, and also long-time simulations driven by oceanic forcing fields. Thus, it would be possible to estimate the results of episodic storms on ocean fields, including waves, currents, and sediments, as well as the results of long-term processes.
- Model Application - Extreme conditions: Big storms are the drivers of episodic change in coastal areas. It is important to reliably simulate the extreme conditions that might occur for the desired period of the infrastructure that is being considered. For this study, the 50-year return period is a minimum requirement. Statistics of extreme events do not generally involve occurrences at regular intervals, therefore, it would be preferable to consider a longer time, such as the 100-year return period.
- Model Application - Marine structure effects: Simulations listed above should compare conditions with the marine structures in place, compared to the baseline results with no marine structures.
Evaluation
This Science Response focuses on key deficiencies in the modelling conducted that have the potential to bring into question the validity of the conclusions in the Proponent's application or supporting documents, for both the base case and the post-construction scenarios modelled.
Model Selection
The use of the Delft3D is appropriate for the intended application. Delft3D is a well-known 3D modeling system which can be used to investigate hydrodynamics, waves, sediment transport and morphology, and water quality for estuarine and coastal areas. Details are available on the website. This code is open source, and has component modules for ocean currents, Delft3D flow (FLOW), morphology (MOR) and waves (WAVE). Delft3D has been used successfully for many applications around the world, for example in Netherlands, USA, Hong Kong, Singapore, Australia, Venice, etc. The software is continuously improved, with new modelling techniques, in response to new research developments, and is maintained and updated by Delft Hydraulics Institute.
Delft3D was coupled with the SWAN numerical model to account for the effects of wave growth and propagation on hydrodynamic conditions. SWAN is a third-generation wave model that computes random, short-crested wind-generated waves in coastal regions.
At the centre of Delft3D, is the FLOW module, which is a multi-dimensional (2D or 3D ) hydrodynamic (and transport) simulation code that calculates non-steady flow and transport phenomena, resulting from tidal and meteorological forcing on a curvilinear, boundary fitted grid, or spherical coordinates. In 3D simulations, the vertical grid can use sigma coordinates, or alternately, geopotential coordinates. Sediment transport is computed by the MOR module (for suspended and total bed load) and morphological changes for an arbitrary number of cohesive and non-cohesive fractions. Currents and waves are drivers for sediment transport. For suspended loads, this module includes advection-diffusion, so that density effects can be taken into account. An important feature of MOR is dynamic feedback between FLOW and WAVE modules, so that currents and waves can adjust to local bathymetry, allowing simulations on time scales from days (for storm impacts) to centuries (climate change impacts). Delft3D can keep track of the bed composition to build up a stratigraphic record. MOR can include features needed to simulate dredging and dumping scenarios.
Model Setup Calibration and Validation
(Section 2, pages 13-44; Section 3, pages 45-64)
Tides: Tidal motions are forced at the open boundaries of the model domain. Comparisons with observed water levels and tidal currents suggest that the model is performing well for tides.
Buoy wind data: The wind forcing used to drive the model consists of a uniform wind field derived from measurements at a local buoy. There is error in using buoy wind data measured at one single point, for example from Environment Canada (EC) buoys or the PNW buoy, rather than using detailed gridded atmospheric winds as driver fields, as DFO has advocated in the previous several, informal reviews. Gridded winds from a mesoscale atmospheric model, such as WRF (Weather Research and Forecasting) model can be constructed. The model is open source, can be downloaded from the internet, and has a user base of several thousand, worldwide. Regarding the former approach, namely the application of buoy winds, it is noted in Table 2-1, page 20, and in Section 10, page 203 that, "It was assumed that spatially uniform winds based upon local measurements at Holland Rock were more accurate than far field winds generated by climate models". No evidence was presented to support this statement. On the other hand, the assumption that there are "uniform winds" is bound to be invalid, given the complicated coastal topography and coastlines, with mountain ranges etc.
Buoy wave data: Wave direction data from NOAA WW3 is used at the outer boundary, plus wave heights from one buoy, (buoy 46205). Measurements at one single point cannot represent the variability of the wave field along the entire outer boundary of the wave model regional grid domain shown on page 17. The latter approach of using a single buoy for waves at the boundary is not the present standard for the waves research community. This approach, adopted by the Proponent, will result in errors; quantifying the magnitude of such errors would require further analysis and is beyond the scope of the present review. Nevertheless, evidence that the approach taken by the Proponent introduces errors is clear in the comparisons between model waves and buoy wave observations at buoy 46145 at Central Dixon Entrance, located about 50 km from buoy 46205 (pages 63-65). Notable errors in the model estimates for significant wave heights occur, sometimes by as much as 50%. Model estimates for peak wave periods also show notable errors. Suggesting that this is not important because the location is far from Flora Bank, and the PNW buoy is more representative of the location of the proposed LNG terminal ignores the fact that, in this study, the model is driven by buoy data at outer boundary points, and therefore should do well in comparisons with Buoy 46145. These errors lead to errors in the swell waves that impact Flora Bank and the area around the proposed marine structures.
Regarding the discussion of "Weekly Cases vs Time Series Approach" in section 4.1, from the Pierson-Moskowitz relations; it is well known that the equilibrium wave state for 5m/s winds is a significant wave height (Hs) of about 0.6m. This is much less than the 4 m wave height suggested on page 28 of the analysis. This is a serious inconsistency in this test, as mean weekly winds of 5 m/s cannot generate mean weekly wind-generated waves of 4 m. Therefore, much of this wave energy must be swell; however, as noted above in the discussion on "buoy wave data", it is evident that the modelling approach does not reliably simulate swell waves.
River discharge: Skeena River discharge is introduced at a model open boundary as a discharge of low salinity water (10 ppt). Flow rates are scaled from values measured upstream from the mouth at Usk. Use of the scaled Usk flow rates is a reasonable approach to setting the Skeena River discharge into the model.
Stratification: The model is initially unstratified and salinity is set to a uniform value of 32 ppt. This implies the necessity of allowing the model to develop vertical stratification and lateral density gradients in response to discharge from the coast. In particular, a sufficient time for adjustment to the coastal runoff must then be allowed. Typically, such a time scale would be of the order of one year. Other forcings that stratify the water column were not included in the analysis, but given that freshwater discharge has the greatest influence on the nearshore density field, this omission is likely less significant.
Sediments: It is important to estimate how errors in winds and waves could influence, or generate errors in estimates for sediment transport. Page 38 describes erosion or deposition rates which vary linearly with t the bottom shear stress, which varies linearly with wind speed, or Hs2:
Erosion = Ml(τ/τce - 1)
A similar relation applies for deposition. Therefore, errors in wave height lead to at least double the errors in erosion or deposition rate. The estimated rate is ~Hs2, implying that a 10% error in waves yields a 20% error in erosion or deposition rates. Put another way, because the similarity scaling relates winds to waves2, a 10% error in winds implies approximately a 40% error in sediment transport. More detailed discussion is presented by Natural Resources Canada, the lead for this topic.
Model Application- Present-Climate Storm Conditions
Long-term Simulations (Section 2.5.1 pages 23- 31)
To simulate the ocean response over a year, 52 integrations, each lasting for a 12.4 hour tidal cycle were run without interruption. The forcing in these runs consists of a ‘representative' semi-diurnal tidal cycle, along with weekly averages of wave, wind and river forcings, with the averaging done sequentially over 52 consecutive weeks. This procedure was repeated five times. While the hydrodynamics in this procedure is integrated for a total of 134 days, fluxes of sediment to and from the sea bed are scaled by a factor, MORFAC, to accelerate the morphological evolution of the model. Based on this scaling factor, the simulations are said to represent a 5 year integration of the morphology.
The consequences of this approach are examined for each of the four main forcings that drive currents and suspended sediment in the model. This is followed by a comment on the use of MORFAC in the model.
Representative tidal cycle: By forcing with an 'average' or 'representative' tidal cycle (see Appendix D.1), the fortnightly modulation of sea level and tidal currents is eliminated. Thus the largest tidal currents, which occur during spring tides, are absent from the simulation. Since sediment transport is dominated by large or extreme events, elimination of the strongest tidal currents will bias the simulation, effectively underestimating the magnitude and frequency of the flows that are most likely to suspend and transport sediment. Similarly, the smaller neap tidal currents, which are most likely to allow sediment deposition, are also absent from the simulations.
Weekly averages of wind and waves: Weekly averaged fields are used for winds and waves. As with the approach taken for the tides, the largest currents associated with peak wind and wave events due to storms are eliminated by the averaging procedure. This results in the under-prediction of storm conditions such that currently most are likely to fall below the threshold that would suspend sediment. Wind speeds of 5m/s cannot generate severe sea-state conditions. Therefore, any study based on this approach essentially filters out storms and extreme events, underestimating or eliminating the states most likely to drive sediment transport.
River Discharge: Since the river discharge varies only gradually on a year-long time scale, the use of weekly-averaged flow rates is, in itself, unlikely to have much effect on the results. Nevertheless, as detailed in the next section, the river forcing, along with its associated sediment load is completely misrepresented in the so-called 'long-term' simulations.
Use of MORFAC: 'MORFAC' refers to a scaling parameter that can be used to accelerate morphological changes when using Delft3D. The manual for Delft3D explains the use of MORFAC under two circumstances. The first is for the coastal ocean where tides are normally present. In this case, the hydrodynamic model is integrated using the time-dependent forcing seen by the ocean, and changes to the morphology are accelerated by the scale factor MORFAC. In this analysis, this is how a MORFAC factor greater than unity should have been used. The manual for Delft3D also mentions using MORFAC in a river application, where there is no periodic tidal forcing. In that case, the time evolution of the hydrodynamics is compressed. The manual mentions an example in which the variation in a river hydrograph that actually takes place over 20 days may be compressed into one that takes place over 2 days with MORFAC=10. The manual states that "for river applications, changing the morphological factor must be associated with changing all external time-varying forcings." It is also stated that "For coastal applications only the overall simulation time should be adjusted." [Emphasis added.] In situations where a river flow and tides are both present, the manual warns that the results may be difficult to interpret when using a morphological factor greater than unity.
The modelling approach adopted by the Proponent inappropriately utilizes the second type of application of MORFAC, in which the hydrodynamics are accelerated. In particular, contrary to the instructions given in the manual for coastal applications, the time varying forcing for the wind, waves and river discharge have been compressed in time such that 1 week of time is compressed into 12.4 hours. One consequence, for example, is that the annual variation in the discharge of Skeena River has been compressed into one that takes place over 26.9 days. Figure 2.9 of the report shows this compressed variation of the river flow. This representation of the river discharge is completely different from the actual time-varying discharge to which the ocean responds. There are several consequences resulting from this misrepresentation, including:
- Since the volume of freshwater discharged into the coastal ocean is the integral of the flow rate over time, the amount of freshwater entering the coastal waters will be drastically reduced from the actual discharge. In particular, it can be shown that for any given time period, it will be reduced to 7.4% of the actual freshwater discharge. Over the course of a year, the Skeena River discharges a total of 49.3 cubic kilometers of freshwater (Morrison et al., 2012). In contrast, the model predicts that about 3.6 cubic kilometres of freshwater is discharged over a period that is purported to represent a year.
- The amount of total suspended solids (TSS) deposited by the river into the coastal ocean over a given period is likewise drastically reduced to just 7.4% of its actual value.
- There is, in fact, no freshet river flow driving the model in the long-term simulations. A freshet is a period of sustained large river flow associated with snow melt. Empirical values for the Skeena River indicate this period lasts for about three months (May – July), and accounts for over half of the annual discharge (Morrison et al., 2012). In the simulation, the model is forced with a rapidly varying river discharge for a total of 134 days. This is radically different than the time variation of the actual river discharge that drives the coastal ocean.
- Since the actual total simulation time is 134 days, the model ocean has insufficient time to adjust to the annual cycle of river discharge, or to seasonal changes in the overall coastal circulation. As a result of the insufficient adjustment time, the stratification and associated baroclinic flows are not properly established.
- The severe underrepresentation of the freshwater discharge is likely to have an impact on the currents over the study area. This is evident from the short test case conducted with the actual river discharge. This case shows that relatively modest changes to the river discharge can lead to appreciable changes in the currents over the study area (Figure 4-20). These results emphasize that it is important to model the river discharge properly.
- The severe underrepresentation of the release of total suspended solids from the river may have a significant impact on the deposition of sediment over the study area in the 'long-term' simulation. This calls into question all the results presented in Section 8.2 of Appendix B, as well as any conclusions regarding water clarity.
Spin-Up Time: For the hydrodynamic component of the Delft3D model, the spin-up time necessary to develop stratification is in the order of one year. A spin-up time of less than one year will underestimate to local ocean stratification In the case of modelling waves, the Delft3D spin-up procedure, which is 24.8 hours, is also not adequate for the SWAN model, for large intense storms. Based on several decades of DFO ocean wave research, a minimum of 48 hours, preferably 72 hours, should be allowed. When the spin-up time is too short, such as the one used in this study, the wave model estimates will be biased low, compared to observations collected at buoys.
Model Application- Extreme Storm Events
(Section 2.5.1 pages 23-31 and Section 9 pages 182-202)
The rationale for considering weather extremes is that changes in extreme events can result in significant impacts to society and the environment. The Intergovernmental Panel on Climate Change (IPCC), (2007) suggests that in a changing climate, "… confidence has increased that some extremes will become more frequent, more widespread and/or more intense during the 21st century". Therefore, evaluation of the implications of weather extremes should be carefully considered because of the likelihood of occurring.
In this assessment, the proposed infrastructure is designed with the assumption that climate is stationary, with an unchanging mean state; even though it is widely accepted that climate change is occurring, and that climate means, variability and extremes may be changing. It is now common practice to design new infrastructures based on historical information on weather and climate extremes. To account for changing climate, the maximum value of a particular variable in the historical record, like winds or waves, is assumed to be the appropriate value for design. The World Meteorological Organization (WMO) recommends that "adaptation strategies to climate change should now begin to account for the decadal scale changes (or low-frequency variability) in extremes observed in the past decades, as well as projections of future changes in extremes, such as are obtained from climate models. Some types of infrastructure currently have little margin to buffer the impacts of climate change." (WMO, 2009).
In this analysis, extreme events are modelled by taking the 20-year time series for winds at the Holland Rock buoy, and applying standard Gumbel distribution methodology to estimate the extreme winds for desired return periods; for example 50-years, 100-years etc. These estimates for 50-year extreme winds are then used to ‘scale-up' a present climate storm to an estimated intensity that appears to match the intensity of the 50-year winds at Holland Rock. However, this particular ‘scaled-up' procedure does not in fact represent the 50-year extreme storm family very well for the Project area. The following outlines deficiencies or errors in the modelling presented:
- Base Cases (Page 182): Storm cases listed in Table 9-1 are quite weak. A longer time series of data is required, as is available at Holland Rock, in order to select more intense candidate storms. As indicted on page 183 of the report, the winds for extreme storms at Holland Rock are 33 m/s and 31.4m/s/ for 100 and 50-year returns, respectively. The modelling conducted uses winds much less than either of these known values.
- 100-year waves at Holland Rock: As was calculated for winds (Figure 9-1), the 50-year wave, and the 100-year wave at Holland Rock should be modelled. This can be calculated from the known buoy data as the record is long enough (20 years listed in Table 2-1).
- The 50-year extreme storm (Page 186): The artificial 'extreme' storm used by the proponent is very poorly constructed. The peak winds last only for 1 hour, and the direction is such that the marine structures have no sheltering effect on Flora Bank, i.e. they are downstream from Flora Bank, thus very little effect is seen on Flora Bank. Different storm configurations should be considered for the 'extreme' 50-year storm so that the most severe storm scenario can be tested, not the most gentle scenario. During the famous 'Perfect Storm' in the North Atlantic in 1991, peak waves were generated and developed over a 24 hour period, reaching 17m, and maintained at that maximum strength for about 6 hours. Peak winds also reached about 33 m/s for 6 hours during the storm, which are rather similar to what is conceivable to occur in the area being modelled, based on Figure 9-1.
- Extreme event (Page 188): The ‘extreme' storm case that is presented is not complete. The orientation of the artificial case should have several scenarios, including the cases where the waves pass Flora Bank first, then the marine structures second; and vice versa, with waves hitting the marine structures first, then Flora Bank, second, etc. The latter cases would show the impact of the marine structures on the Flora Bank area. The extreme storm cases should also consider storms where uniform winds are blowing at various angles with respect to the marine structures, Flora Bank and Agnew Bank, and holding steady for at least half a day, or more, and include simulations with, and without, the marine structures to see the full effects of the marine structures on the surrounding region. Model runs should show the full possible effects. Winds should be at the 50-year return levels, at least, and ideally also include 100-year return levels.
- Morphology (Pages 198-202): The effect of extreme storms on morphology is modelled so that the minimal possible effect of the marine structures is tested, rather than cases where the marine structures can effect Flora Bank (see details above)
Representation of Marine Structures and their effects
(Section 2.6, Pages 33 – 37)
The marine structures that are proposed to be installed on the seabed adjacent to Flora Bank consist of an anchor block and a tower that will support a suspension bridge, and a series of trestle bents arranged along the length of a trestle. There is also the berth for ships to dock, which will be supported by a set of piles. The anchor block is easily the largest of the structures, with dimensions of 45 metres x 44 metres, while the dimensions of the tower are 20 metres x 36 metres. Both will extend through the water column. The trestle bents consist of piles of 1.2 metre diameter. The number of piles in each trestle bent is not mentioned.
Due to the relatively coarse resolution of the model (from 1000 to 60 metres), all of the structures are smaller than the grid spacing. Accordingly, they have been parameterized in the model as 'porous plates', which is one of the options available in DELFT3D to represent sub-gridscale structures. Drag coefficients must be specified for each of the porous plates. In this regard, a fractional reduction in the flow rate through a grid cell containing a porous plate (the 'permeability') is assumed based on the dimensions of the structure relative to the grid scale. A drag coefficient for the porous plate is then specified to achieve this assumed permeability.
The following are some observations regarding the modelling of the marine structures:
- The use of porous plates seems warranted in cases of the trestle and the berth which are both extended linear structures. For these structures the supports are small and widely spaced and the assumed permeability of 90% seems reasonable.
- A set of auxiliary experiments in an idealized setting (a model of a canal) were conducted to calibrate the drag coefficient of the porous plates to obtain the required permeability. While such experiments are useful as a guide to setting the drag coefficient, no information is given as to whether the desired permeability is actually achieved in the regional model.
- There should be drag specified in both of the horizontal coordinate directions, at least for the anchor block and tower. No specific information is given, but the fact that only a single drag coefficient is specified for each suggests that this is not the case.
- In the case of the anchor block and the tower, flows impinging on such large structures will be blocked on the upstream side and accelerated along the sides of the obstacle. At the trailing edge there will be boundary layer separation and a turbulent wake in the lee of the structures. Given the proximity of the proposed structures to Flora Bank, the jet-like flows and vortices that will be shed in the lee of the structure can be expected to impinge on the sides of the Bank during flood tide. There is potential for these energetic flows to scour the Bank.
- The relatively coarse resolution of the model (which necessitates the porous plate parameterization) is problematic for modelling the effect of the two large structures (the anchor block and the tower), and it is far from clear whether the effects of these structures is adequately represented. In particular, it is likely that the model is unable to adequately resolve the strong flows and shear generated in the lee of the structures. The turbulent flows and vortices that will be shed in the lee of the anchor block and tower are probably absent in the simulations, and the jet-like separated flows are bound to be more diffuse than in reality. All of this is likely to bias the results to underestimating the effects of these large structures. The obvious remedy for these problems would have been to conduct simulations that are of locally much higher resolution (perhaps in a nested model) in which the marine structures and turbulent flows are explicitly resolved.
- It is evident from several of the figures in the Report (e.g., Figure 5-10, 5-14) that some of the largest perturbations to the currents in the model are due to the anchor block and the tower. This emphasizes the need to represent the influence of these two structures accurately since they seem to have most importance.
Conclusions
DFO Science has previously conducted four reviews and provided feedback on draft analyses conducted by the Proponent on the baseline hydrodynamic regime, and the potential changes that may occur as a result of the installation of marine structures near Flora Bank. Many of the deficiencies and problematic aspects of the analyses noted in these previous reviews remain unaddressed in the final Appendix B: Pacific Northwest LNG – 3D Modelling of Potential Effects of Marine Structures on Site Hydrodynamics and Sedimentation. This review has again identified numerous and significant deficiencies and errors in the modelling procedures, input data, and assumptions, as well as in the assessment of uncertainties. Therefore, the results and conclusions presented in the Proponent's analysis are not substantiated. Given the nature of these deficiencies, it is likely that the magnitude and extent of the impact of the marine structures is underestimated.
The following are the main observations and conclusions of this review:
- In the ‘long-term' simulations, the model is driven by a ‘representative' tide, along with weekly-averaged winds, waves and a river discharge in which the annual cycle is compressed into a 26.9 day period. This modelling procedure is of doubtful validity, and at variance with instructions given in the manual for the model. In the case of the river discharge, it is demonstrably incorrect.
- The weekly averaging of the winds and waves eliminates the peaks in these forcing fields associated with the passage of storms, while use of a representative tide eliminates the largest tidal currents associated with spring tides. As a result, the likelihood of exceeding the critical threshold for sediment suspension and transport is underestimated in the model. As well, elimination of neap tides reduces the likelihood of meeting the threshold for sediment deposition.
- The volume of freshwater and amount of suspended sediment discharged from the Skeena River into the coastal ocean is severely underrepresented in the model. This will lead to an underestimation of the buoyancy-driven circulation, as well as of the total suspended solids (TSS) in the water column. This observation casts considerable doubt on the assessment made regarding the impact of changes in the distribution of total suspended solids and in water clarity.
- The ‘spin-up' time allowed for the circulation driven by waves, winds and (especially) the buoyancy forcing to become established is too short. As a result, these motions are likely underrepresented. Similarly, the spin-up time allowed for the wave-module in Delft3D, per se, is too short, and would likely result in wave simulation estimates that are biased low.
- The anchor block and tower are, by far, the largest of the marine structures the Proponent proposes to install. Despite their large size (44m by 45m in one case), the grid resolution of the model is insufficient to explicitly represent these structures, and they are instead parameterized as porous plates. As a result, the model does not properly represent the acceleration of the flow that will occur on the sides of these blocks. The resolution of the model is also insufficient to represent properly the downstream turbulent wake and separated flows on either side of the anchor blocks, and the vortices generated by these anchor blocks that will be shed downstream and interact with Flora Bank. There is potential for these energetic flows to scour the sides of Flora Bank, but it is not possible to assess the extent to which this will occur based on the reported simulations.
- The analysis does not adequately consider an extreme storm for the 50-year return period, or an appropriate set of 50-year extreme storms, thereby underestimating the potential impact of the installation of marine structures on the surrounding environment. Although the Proponent does estimate the 50-year and 100-year winds at the Holland Rock buoy, based on 20 years of observed data, and application of standard extremal analysis, applying the well-known Gumbel distribution relation for the wind data, several of the other conditions needed to estimate extreme 50-year extreme storm impacts are scaled back or not explored. In particular, the analysis only considers a storm propagation direction that orients the marine structures downstream from Flora Bank, thus making it essentially impossible for the marine structures to impact Flora Bank. In addition, to fully explore the maximum severity of possible 50-year extreme storms, the duration of the maximum storm-generated winds should be modelled for multiple hours not one hour, for example half a day, and the winds considered at the known maxima, not scaled back by 15%, as in the current analysis.
Contributors
| Contributor | Affiliation |
|---|---|
| Patrick Cummins | Author, DFO Science, Pacific Region |
| William Perrie | Author, DFO Science, Maritimes Region |
| Charles Hannah | Author, DFO Science, Pacific Region |
| Diane Masson | Author, DFO Science, Pacific Region |
| Marilyn Hargreaves | Editor, DFO Science, Pacific Region |
Approved by
Carmel Lowe
Regional Director
Science Branch, Pacific Region
Fisheries and Oceans Canada
May 20, 2015
Sources of information
Hatch, 2015. Pacific Northwest LNG – 3D Modelling of Potential Effects of Marine Structures on Site Hydrodynamics and Sedimentation. H345670-0000-12-124-0012, Rev.0
Intergovernmental Panel on Climate Change, 2007. IPCC Fourth Assessment Report: Climate Change 2007. (Accessed 19 May 2015)
Morrison, J., M. G. G. Foreman & D. Masson. 2012. A Method for Estimating Monthly Freshwater Discharge Affecting British Columbia Coastal Waters. Atmosphere-Ocean, 50:1, p.1-8.
Stantec Consulting Ltd., 2013. Pacific Northwest LNG Technical Data Report – Marine. Project No. 1231-10537.
World Meteorolgical Organization. 2009. Guidelines on Analysis of extremes in a changing climate in support of informed decisions for adaptation. Climate Data and Monitoring WCDMP-No. 72. (Accessed 19 May 2015)
This Report is Available from the
Centre for Science Advice
Pacific Region
Fisheries and Oceans Canada
3190 Hammond Bay Road
Nanaimo, BC V9T 6N7
Telephone: (250) 756-7208
E-Mail: csap@dfo-mpo.gc.ca
Internet address:www.dfo-mpo.gc.ca/csas-sccs/
ISSN 1919-3769
© Her Majesty the Queen in Right of Canada, 2015
Correct Citation for this Publication:
DFO. 2015. Technical review of 3D modelling of potential effects of marine structures on site hydrodynamics and sedimentation from the construction of the pacific northwest liquefied natural gas terminal. DFO Can. Sci. Advis. Sec. Sci. Resp. 2015/027.
Aussi disponible en français :
MPO. 2015. Examen technique de la modélisation en trois dimensions des effets potentiels des structures marines sur l'hydrodynamique du site et la sédimentation découlant de la construction d'un terminal de gaz naturel liquéfié dans le nord-ouest du Pacifique. Secr. can. de consult. sci. du MPO, Rép. des Sci. 2015/nnn.
Annex III - Outstanding Information from Information Request #2
1. Effects on Current Use of Aboriginal Fisheries for Traditional Purposes
Issue & Information Requested: The Agency requested that the information received from Aboriginal groups on Traditional Knowledge/Traditional Use be incorporated into the environmental assessment in order to effectively support a conclusion regarding environmental effects of the Project on the current use of lands and resources for traditional purposes. The Agency's analysis is informed by effects to resources, such as fish and fish habitat on Flora Bank. This information is critical given the importance of Flora Bank to Aboriginal groups.
Information provided: The proponent's assessment of effects on current use of lands and resources for traditional purposes is based on limited information on fish and fish habitat.
Remaining information: The Agency requires that information provided in response to this letter must include assessment of the Project's effects on current use of lands and resources for traditional purposes.
2. Effects on Marine Mammals
Issue and Information Requested: Limited baseline information was provided by the proponent on marine mammals. The Agency, informed by advice from DFO and comments received from Aboriginal groups and the public, requested that the proponent provide addition information regarding alternative suitable habitats:
- "Marine mammals are known to be found in conjunction with concentrated prey. If marine mammals are deterred from feeding on the prey found within the PDA and LAA from noise or water quality, are there other abundant prey sources (suitable habitat) in the area that the species can feed on? Please decribe this suitable alternative habitat (location, species of prey and timing)" (August 14, 2014 technical table, Marine Resources #5).
Information provided: The proponent provided abundance estimates within the Queen Charlotte Basin for some species likely to be affected by the Project, making reference to some high density areas.
Remaining information: The Agency requires information on alternative suitable habitat for marine mammals that includes by species: specific locations, species or prey, and expected timing of use, based on available information. In order to assess the residual effects to marine mammals from underwater noise and associated avoidance behaviours, explain how the availability and suitability of any alternative habitats reduces overall adverse effects to marine mammals.
3. Effects of Dredged Material Disposal
Issue and Information Requested: The proponent did an assessment of the effects of sediment disposal at Brown Passage assuming that material could be permitted for disposal at sea. The proponent did not assess the effects of disposing of sediment on land should be disposal at sea not prove feasible. The IRs asked that:
- "all potential management options(s) for the dredged material (including alternative disposal at sea locations and proposals for beneficial use) will need to be finalized as part of the EA review in order that the site-specific effects related to these options can be adequatley assessed." (August 14, 2015 technical table, Marine Resources #11, Annex 1).
Information provided: The proponent described in Appendix G.5 that:
- "Dredging of a marine terminal berth area will no longer be required for project construction, resulting in a substantial decrease in the amount of dredged sediment to be disposed. Although dredging of the materials offloading facility (MOF) will still be required, advancements in engineering design have resulted in a refined estimate of less than 200,000 m3 of sediment to be dredged (in comparison to the 615,000 m3 originally cite in the EIS). As a result, alternative to the previously-used ocean disposal site at Brown Passage are no longer under construction. A permit will be sought under the Canadian Environmental Protection Act for all dredged sediment from the (MOF) to be disposed of at Brown Passage."
We understand that, as a result of your discussions with Environment Canada in relation to a permit for Disposal at Sea, that PNW intends to dispose of some dredged material on land. Currently effects to valued components as a result of disposal of sediment on land have not been assessed.
Remaining information: The Agency requires information on the proponent's plans regarding disposal of dredged material on land and associated effects. Additionally, the Agency required information on measures to mitigate any environmental effects.