
Interactive Assessment Map: Detailed Guide
The Interactive Assessment Map is a powerful web-based application that allows users to explore, visualize, and process assessment information using an intuitive mapping interface. It is available through the View Map button on the Registry landing page.
The latest updates to the interactive map include:
-
Access to embedded layers within the map including:
- Proponent data submissions to visualize the assessment project area and related components to promote transparency; and
- Relevant environmental and Indigenous Peoples information layers for data-driven decision-making.
-
Additional tools outlined in the guide below allow users to:
- Locate an assessment, place, or other areas of interest;
- Explore the available data layers embedded in the map; and
- Analyze the data by overlaying layers in the map and exploring proximity and patterns using the functions available.
Part 1: Locate
Part 2: Explore
Part 3: Analyze
Part 1: Locate
This section outlines how to locate an assessment or place by searching, using the navigation tools to adjust the map’s extent, and opening an information window to see more information about any given feature shown on the map (Figure 1).
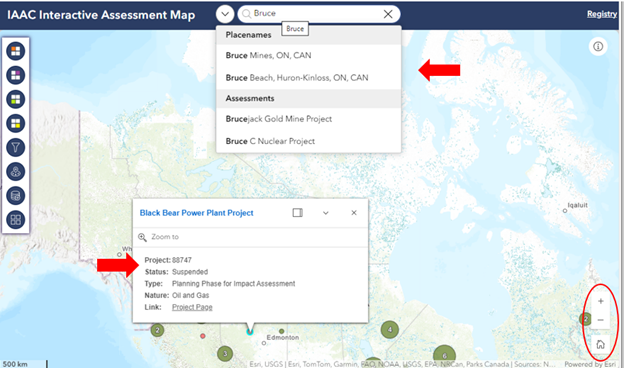
Figure 1: Interactive assessment map
Search Tool
Enter keywords into the search bar in the top banner to search for an assessment or a place.

Suggested results are organized by
- Placenames: all options available within Canada; or
- Assessments: data that is currently available on the public registry.
From the search result dropdown, select the result that meets the search criteria to view it on the map. Once selected, a symbol is highlighted, and the map automatically zooms to a closer extent while also displaying the information window for the selected feature (Figure 1).
- The search tool can only display one result at a time and display it on the map.
- To filter for multiple assessments simultaneously based on criteria use the advanced filtering tool, see the Filter tool described in Part 3 of this guide.
Navigation Tools
The navigation tools can be found in the bottom right corner of the map view. Select one of the following tools to adjust the map extent and navigate to your area of interest:


Notes:
- In the Desktop view, use the mouse scroll wheel to zoom in (+) or out (-).
- In the Tablet and Mobile view, zoom in or out by pinching the screen with two fingers.
Information window
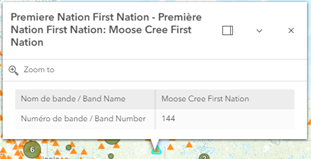
Click any feature on the map (point, line, polygon, or cluster) to open the Information window as shown below in Figure 1a and Figure 1b.
The information provided in the window provides a summary of key information about the layer. The window content will differ for each layer depending on the source and type of layer selected.
For example, an Assessment feature (Figure 1a), outlines information such as type, status, and the link to the project page, whereas a First Nation feature (Figure 1b) only outlines information such as the band number and name.
To access the project home page to find out more about the assessment click on the link to the Project Page provided in the assessment information window as highlighted in Figure 1a.
Select the “Zoom to” option in the information window to automatically zoom closer to the selected feature and explore the vicinity using the map.

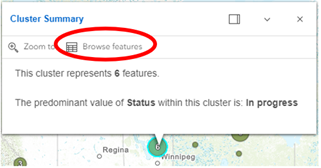
Clusters
Depending on the concentration of the Assessment features on the map, some have been grouped to form clusters to avoid clutter on the map. The cluster displays the number of features it represents. Click on a cluster symbol on the map to get a Cluster Summary and to sift through the assessments in the area.
To view the assessments within a cluster, select the Browse Features option (Figure 1c) which opens the list of assessments that are clustered together. Select an assessment from the list to open its information window (Figure 1d).

Part 2: Explore
This section describes the common layer controls used to add data to the map, explore available data layers embedded in the map, add external data, and change the background map.

Figure 2: View of data layers tools
Common layer controls
Each layer includes different controls that allow users to:
- add or remove them from the map;
- view the layer legend and symbols used to display features on the map; and
- other options to export the layer features in useful formats or to view the layer details (e.g. description and sources).
The following table provides a short description of the common layer controls available:


Data layers
Layers are groups of common geographic features that can be overlayed on a map to view multiple datasets simultaneously. To visualize assessments alongside other datasets you can explore the embedded layer lists, turn layers on and off, and zoom into the area of interest.
For example, you can explore First Nations or National Parks near a given assessment location.
The layer types available in the application are accessible from the top four icons of the left toolbar and highlighted in red in Figure 2 above.
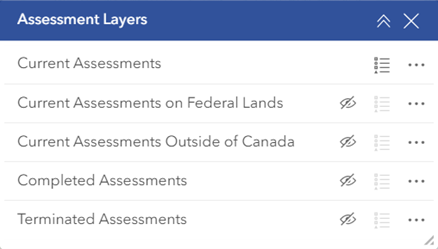
Figure 3: Assessment layers’ group
Assessment Layers are organized by status representing current, completed, and terminated assessments (Figure 3) which can be added to the map by clicking the visibility icon.
Current assessments are further subdivided by type to differentiate between current assessments on Federal Lands and assessments outside of Canada.
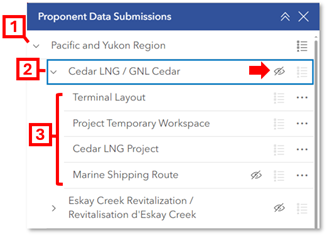
Figure 4: Proponent data submissions layers
Proponent Data Submissions provide information on assessment boundaries and components. They are grouped by regional area (Figure 4). Within this sub-group, the assessment title contains all layers submitted for a given assessment.
- Regional area
- Assessment title
- Individual layers submitted by project proponents
Proponent geospatial data layers are provided by external sources and are not subject to official languages, privacy, and accessibility requirements.
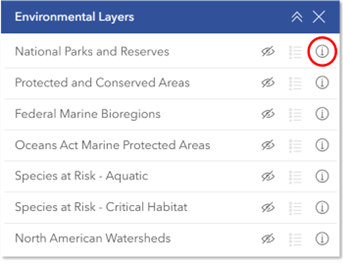
Figure 5: Environmental layers’ group
Environmental Layers are a selection of frequently used layers (Figure 5) that can be added to the map to overlay against other data layers to visualize their proximity and potential impacts.
These layers are managed by various other departments and are available from open sources. For more information about these layers and sources select the details icon (as circled in the image) to view the layer metadata.
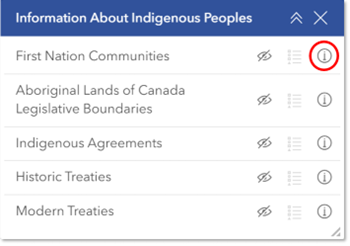
Information About Indigenous Peoples is a selection of frequently used layers (Figure 6) that can be added to the map to overlay against other data layers to visualize their proximity and potential impacts.
These layers are managed by other departments and are available through open sources. For more information about these layers and sources select the details icon (as circled in the image) to view the layer metadata.
The layers included in the layer lists are relevant to the impact assessment process and are important for planning, analysis, and decision-making. Additionally, external data can be uploaded to the map using the Add Data tool, described in Part 3 of this guide.
The Assessment locations are approximate and represent the center location of the project area. More than one location can be provided for a linear project to reflect the start and end of a project, such as a highway or access road.
Basemaps
The Basemap tool is the last button in the left toolbar. It provides a gallery of basemaps that can be used to change the background of the map to emphasize various aspects of the country’s geographic features. All basemaps are available in both official languages.
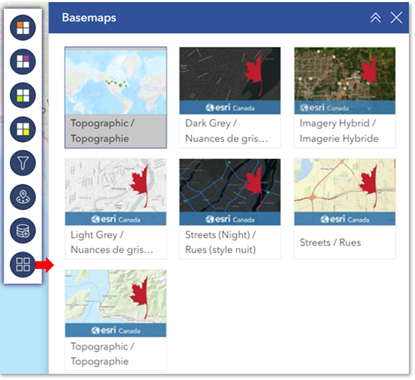
Figure 7: Basemap gallery
Part 3: Analyze
This section provides details and step-by-step instructions on various analysis tools that are embedded in the map. These tools can be used to perform analysis such as filtering active data layers, using the nearby tool to assess proximity to areas of interest, exporting the results in various formats for further analysis, and adding external datasets.
Filter
Filters search through the assessment dataset by applying the selected criteria such as location, assessment type, and nature of activity. More than one value can be added for each parameter.
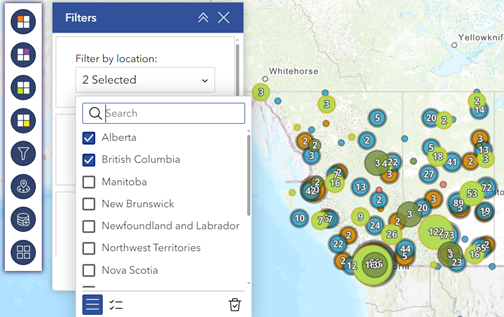
Figure 8: Map displays filtered results for all assessments in selected locations.
For example:
- Location: “British Columbia” and “Alberta”
- Assessment Type: “Impact Assessment by Substitution” and “Regional Assessment”
- Nature of Activity: “Oil and Gas” and “Ports and Harbours”
Notes:
- The results will automatically populate the map as the criteria are selected or removed.
-
The filter only refines assessment layers that are visible on the map.
-
For example, to include Completed Assessments in the filter search, ensure the layer is “visible” on the map by clicking the visibility icon
 .
.
-
For example, to include Completed Assessments in the filter search, ensure the layer is “visible” on the map by clicking the visibility icon
Nearby
The Nearby tool allows users to easily select a location on the map by dropping a pin on the map and searching for data layers that are within a certain search radius from the pin location. A list of results within the buffer (search radius) will populate and can be immediately viewed on the map or exported for further analysis in different formats.
For example, to see which National Parks, First Nations, and Assessments are within 150km of where a pin is dropped, follow these steps:
- At the top of the nearby tool, set the distance parameters for the search radius.
-
Click the pin icon
 to activate it.
- Drop the pin by clicking on the map at the desired location.
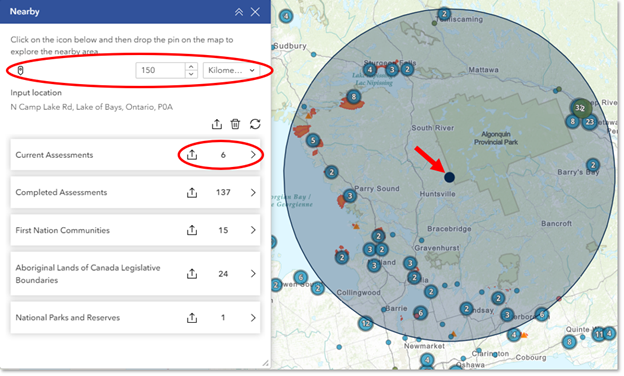
Figure 9: Nearby tool results and map
Once the pin is dropped, the tool searches and gathers assessment, environmental, and indigenous layers within the radius/buffer. The results are displayed beneath the parameters in categories, as shown in Figure 9.
The results banner can be expanded into a thorough list using the arrow to the right of the layer circled in the image above.
When hovering over the results in the lists, their location will be highlighted on the map.
Explore more details by clicking on the results in the list, or directly on the map to open its information window.
Lastly, to export the results for further analysis, select the export button on the right of the layer name.
The results depend on the data features available in the geographic vicinity selected through the parameters. If no results appear, adjust the search parameters and pin location on the map.
Add data
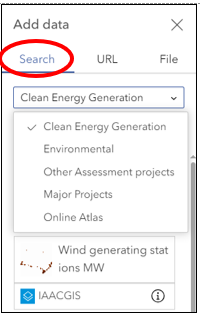
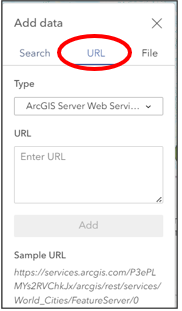
While there are many datasets embedded in the map, there is flexibility to upload external data to view on the map using the Add Data tool, using one of three methods below:
- The Search tab (Figure 10a)) lists available data themes from the dropdown menu. Select from one of the curated lists in the dropdown. For example, select the Clean Energy Generation list (as shown above), then click on the “Wind generating stations MW” data layer to select it. Click Done to add and view this data on the map displaying the locations of Wind stations in Canada.
- The URL tab (Figure 10b) is for entering URLs from open data sources, such as web services. Copy and paste a data URL into the “Enter URL” box. For example, the link below from the Open Government Portal represents the web service for the Orphaned and Abandoned Mines in Canada. Copy the URL link below, paste it into the box, and click Done to add and view the data on the map. URL: https://maps-cartes.services.geo.ca/server_serveur/rest/services/NRCan/oam_en/MapServer/0
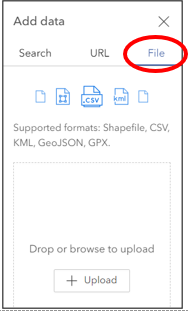
- The File tab (Figure 10c) is for uploading local files such as shapefiles, CSVs, or KMLs. Drag and drop or browse geographic data you have stored locally for any data in the form of a “.kml”, “.csv” or “.shp”. Once selected, click Done to add to the map to view. You can download geospatial data from the Open Data Portal and upload it here to view alongside assessment data and other layers available.
Please note: this detailed guidance document will be updated as additional content is developed, to address frequently asked questions and other user needs.